
Contribution margin for DTC is the number that decides whether your "winning" ad account is actually building cash or quietly setting it on fire. Revenue ROAS celebrates orders that lose money. CM2 is the math that stops it.
Most accounts I open are scaling against a breakeven line that does not exist. A 4x ROAS gets celebrated in the buyer dashboard the same week the CFO closes negative, because nobody has subtracted what it actually costs to put the product in the customer's hand.
The number that sets your breakeven ROAS
Contribution margin is the cash left on an order after every variable cost except ad spend. Divide 1 by your CM2 percent and you get the ROAS you must beat to stop burning cash.
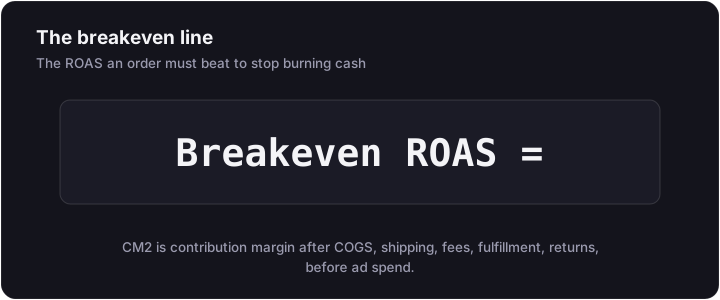
That equation, sourced from the operator-led frameworks that now dominate DTC finance, is the entire game. Everything below is either how to calculate CM2, or how to act on the ROAS it spits out.
CM1, CM2, CM3: the margin ladder
Treating "margin" as one number is how brands end up with a 70% gross margin on the dashboard and a negative bank account at month end. The fix is a three-rung ladder, each rung built for a different team.
- CM1 (product economics): Net revenue minus landed COGS, which includes freight, duty, and packaging to get the unit into the warehouse. This is the true gross margin. Merchandising and sourcing teams live here.
- CM2 (operational reality): CM1 minus outbound shipping, payment processing fees, variable 3PL pick-and-pack, and the cost of processing returns. This is the marketing floor. It is the cash available to spend on acquiring a customer before the order goes negative.
- CM3 (acquisition truth): CM2 minus allocated ad spend. If CM3 is positive, the order generated cash. If CM3 is negative, you paid a customer to take inventory off your hands.
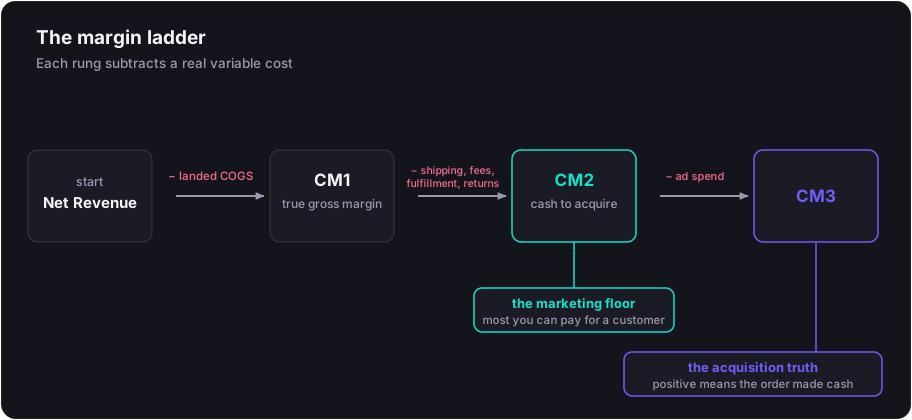
The reason this matters operationally: media buyers can only act on what they can see. Hand them CM2 per SKU and they can set sane ROAS targets. Hand them only revenue and they will optimize you into insolvency.
How to calculate per-order contribution margin
The formula is unforgiving:
CM3 = Net Revenue − (COGS + Outbound Shipping + Payment Fees + Return Logistics + Variable Fulfillment + Allocated Ad Spend)
Run a single order all the way through. Take a skincare brand selling two units of a serum at $60, charging $5 shipping, with $14 unit COGS. The Shopify dashboard will tell a triumphant story: $125 in net revenue, ~$97 in gross profit, a 77% gross margin. Now walk down the ladder.
| Line Item | Value (USD) |
|---|---|
| Gross Revenue (Products) | 120.00 |
| Shipping Revenue | 5.00 |
| Total Net Revenue | 125.00 |
| Product Cost (COGS) | -28.00 |
| Carrier Shipping Cost | -7.50 |
| Payment Processing Fee (~2.9%) | -3.50 |
| Fulfillment (3PL pick and pack) | -4.00 |
| Contribution Margin 2 (CM2) | 82.00 |
| Allocated Ad Spend (CAC) | -27.00 |
| Contribution Margin 3 (CM3) | 55.00 |
| CM3 Percentage | 44.0% |
The dashboard story and the ledger story are different businesses. The $125 of revenue produces $82 of operational margin, and the $27 CAC leaves $55 of actual cash. A 44% CM3 here is healthy. Cut one unit out of that basket with the same $27 CAC and the entire order flips toward unprofitable, a swing that revenue ROAS would never flag.
Why "gross margin healthy" still means cash-negative
Gross margin lies by omission. It subtracts the factory invoice and stops. Outbound shipping, payment processing, pick and pack, and return logistics are not optional in DTC, and together they typically erase 30 to 40 percentage points of that headline margin.
This is how a buyer celebrates a 4x ROAS at the exact moment finance closes the month negative. The buyer is measuring revenue per ad dollar. The CFO is watching the cash that arrives after the carrier, the processor, the 3PL, and the returns desk have all taken their cut.
The fix is structural: the ROAS targets a buyer optimizes against must be derived from CM2, not chosen from a benchmark deck or set by intuition.
Breakeven ROAS: the 1 / CM2% formula
Once you have CM2, breakeven ROAS is a one-line calculation. It is the ROAS at which an order's variable costs are perfectly covered: zero profit, zero loss.
Breakeven ROAS = 1 ÷ CM2%
The number swings violently across product profiles, which is why a uniform account-wide ROAS target is a cash incinerator across a mixed catalog.
| CM2 Profile | Example Vertical | Breakeven ROAS |
|---|---|---|
| 60% | High-margin skincare | 1.67x |
| 50% | Premium beauty | 2.00x |
| 40% | Standard apparel | 2.50x |
| 30% | Heavy or returnable goods | 3.33x |
| 20% | Thin-margin commodity | 5.00x |
Set an account-wide target of 3.0x and the skincare line gets artificially throttled at well below its potential while the thin-margin SKUs scale aggressively below their breakeven and drain cash with every order. The target has to be set per CM2 profile, not per account.
Target ROAS: adding the profit you actually want
Breakeven keeps you alive. Target ROAS is what you set when you want the account to actually fund the business.
Target ROAS = 1 ÷ (CM2% − Target Profit %)
A brand with a 50% CM2 that wants 20% operating margin after ad spend solves 1 ÷ (0.50 − 0.20) = 3.33x. That number is not negotiable and it is not an industry benchmark. It is the mathematically correct floor for what a campaign must clear to satisfy the business's profit goal. Every ROAS target in your account should be derived this way.
Setting your CAC ceiling from CM2
CM2 in dollars, not percent, is your maximum profitable first-order CAC. If your AOV is $100 and CM2 is 50%, you have $50 to spend on acquiring that customer before the first order goes underwater. Spend $51 and the brand is buying revenue at a loss on every transaction.
Brands willing to fund a payback window can spend above first-order CM2, but that is a working-capital decision, not a campaign decision. The math of when that is sane lives in the LTV to CAC ratio, the fully-loaded CAC numerator, and the lifetime value inputs that justify the wait.
What does not change: CM2 is the line. Anything beyond it must be defended by a real, cohort-tested LTV curve, not a hope.
Where revenue ROAS quietly lies
Revenue ROAS treats every dollar of sales identically. A $1,000 high-margin cosmetic order and a $1,000 heavy, returnable, low-margin electronics order both register the same on the dashboard. The platforms reward the cheaper one, which is almost always the one with the worse contribution profile.
It also rewards discounting that destroys CM3. A 40% off promotion can double conversion volume and inflate ROAS while eliminating the underlying margin entirely. The buyer earns a bonus; the brand pays for the customers it just lost money on.
| Metric | Formula | What it measures | Blind spot | What it optimizes for |
|---|---|---|---|---|
| Revenue ROAS | Attributed Revenue ÷ Ad Spend | Top-line revenue per ad dollar | Ignores COGS, shipping, fees, fulfillment, returns | Conversion volume; rewards margin-destroying discounts |
| Contribution Margin (POAS) | Gross Profit ÷ Ad Spend | Net cash per ad dollar after variable costs | Requires server-side data plumbing, slower to populate | Net profitability; naturally starves low-margin SKUs |
For the account-wide blended view that catches what the platforms over-claim, pair CM3 with MER so attribution overlap cannot flatter the numbers.
Feed margin to the algorithm: POAS in one section
Once you know CM2 per SKU, the highest-leverage move is to stop sending revenue back to the ad platforms and start sending profit. That is what POAS means in practice.
POAS = Gross Profit ÷ Ad Spend
The mechanics are short. Map CM2 to every SKU in your catalog. Use a server-side pixel (server-side tracking covers the data plumbing) to send the CM2 dollar figure as the conversion value instead of the order total. Switch the platform objective off "Maximize Conversion Value" and onto the custom profit event. The Smart Bidding algorithm now hunts for margin-dense customers instead of high-revenue ones.
The published result brands point to is My Next Mattress, a UK retailer that restructured Google and Bing accounts around POAS rather than ROAS. Within 90 days they moved POAS from 1.8x to 3.2x (a 78% lift) and dropped CPA 32% (from $145 to $98) while conversion rate climbed 30%. That is a third-party finding, not a Chance Ecom result, but it is the cleanest public proof that feeding the right number to the algorithm rewires what the algorithm chases.
The attribution stack that surrounds this feed is where most teams stumble; the feed itself is a one-week build for a brand that already knows its CM2.
Scaling without compressing margin
Aggressive scaling compresses margin. As budget rises, the algorithm exhausts the responsive warm audience and reaches into broader cold audiences. Marginal CAC climbs. Conversion rates soften. CM3 thins even when ROAS still looks acceptable against a benchmark.
A campaign that drops from 4.0x to 3.0x ROAS reads as a manageable slip. On a 35% CM2 product, that same drop pushes the campaign into negative CM3 on every additional sale.
A weekly guardrail for paid social scaling looks like this:
- Refresh the live breakeven ROAS weekly. CM2 moves when carrier rates, payment fees, or CPMs move, and the breakeven line moves with it.
- Rank every campaign by CM3 dollars generated, not by ROAS multiple. A 2.5x campaign producing $40k of CM3 is more valuable than a 5.0x campaign producing $4k.
- Pause anything below the live breakeven line regardless of revenue volume. Top-line is the thing that hides the bleeding.
- Pair CM3 with a blended check weekly so platform attribution overlap, which inflates reported revenue 20-40% in standard cases, does not flatter the picture.
Common traps that hide negative CM3
The math is rarely wrong because the formula is wrong. It is wrong because of one of these, almost always:
- Returning customers in the denominator. Acquisition math counts first-time buyers only. Mixing repeat purchasers in understates CAC by 30 to 60% and makes a breaking business look healthy.
- Refunds and carrier surcharges that land 14 to 30 days after the click. CM3 looks fine at conversion time and collapses by month end. Real-time webhooks back into the conversion feed are the only durable fix.
- Fixed marketing cost left out of allocated ad spend. Agency retainers, creative production, and the SaaS stack (Triple Whale, Klaviyo, Elevar, attribution tools) routinely add 25 to 50% on top of raw media spend. Leave them out and CM3 reads about 30% richer than reality. The fully-loaded CAC numerator covers what actually belongs in the line.
- One account-wide ROAS target across mixed CM2 SKUs. High-margin lines under-scale. Thin-margin lines bleed. Both problems live in one number.
What to do this week
A five-step run that any in-house team can execute against the last 30 days of data:
- Calculate CM2 per SKU using actual shipping, payment fees, fulfillment, and return rates from the last 30 days. Not the negotiated rates from your 3PL deck. The real numbers off invoices.
- Compute breakeven ROAS at the SKU level (
1 / CM2%). Group SKUs into CM2 bands so buyers have a target per band, not per account. - Set the CAC ceiling at first-order CM2 in dollars. If you want to go above it, write down the LTV curve and payback window you are willing to fund, and route that decision to finance.
- Re-score every live campaign by CM3 dollars generated last week. Pause the bottom of the list and reallocate the budget to the top, regardless of what their ROAS multiples say.
- Plan the server-side POAS feed. Map CM2 to SKUs in your product catalog, wire the conversion value override, and switch campaign objectives onto the profit event.
Most teams find a 10 to 20% margin lift in the first month from steps one to four alone, before the POAS feed ships.
Get the margin math right before you scale
The diagnostic answer almost always sits in CM2, and almost no one is looking at it. If your account is scaling against the wrong breakeven line, the lift from fixing the math is larger than the lift from any creative test or audience experiment you can run.
A paid media audit is where this gets stress-tested against a live account: CM2 per SKU, breakeven ROAS by band, the CM3 ranking of every campaign, and the POAS feed plan. If the audit finds that the math is fine and the creative is what is killing CM3, that is a different fix and lives with the creative engine.
Either way, you stop scaling against a number the platforms invented.