What a DTC Paid Media Audit Actually Checks (and Why)
A real paid media audit is a diagnostic, not a checklist of "best practices." Doctor before waiter. Before we touch a single bid, we want to know whether the business can afford the customer it is buying, whether the data feeding the algorithm is real, and whether the post-click experience earns the click. Then we look at creative, then structure, then channels. In that order, because the layers gate each other.
What a paid media audit actually checks
A real paid media audit is a seven-layer X-ray of the account: unit economics, tracking integrity, creative throughput, hook and hold diagnostics, landing pages, account structure, and channel mix. If any one of those layers is broken, more spend just amplifies the damage.
The order matters as much as the list. You cannot restructure an account on broken data. You cannot scale creative when the landing page bounces 70% of traffic in five seconds. You cannot evaluate a channel that is double-counting other channels' conversions. Foundation before scale, every time.
A full audit is the proactive full-system version of the conversation. If the panic is "ads stopped working this week," read why ads stopped scaling instead, which is built for triage. This one is the annual physical.
Who this audit is for and when to run it
The full-system pass is built for DTC brands spending mid-six figures and up per month across paid social and paid search, where the cost of being wrong for a quarter exceeds the cost of a careful look.
Three triggers send brands into an audit:
- MER is drifting downward while platform ROAS dashboards still look fine.
- A scaling plateau has set in, usually somewhere between $25k and $30k of daily Meta spend.
- Someone new has just taken over the account (new CMO, new agency, new in-house buyer) and needs a clean baseline.
There is also a fourth, quieter reason: a preventative annual pass to make sure nothing has rotted while the dashboards looked green. The same diagnostic, run early, is the difference between an adjustment and a rebuild.
Pillar 1: unit economics, the solvency check
The first question a media auditor asks is not about ads at all. It is whether the business can afford to buy a customer at today's CAC.
Gross margin is not the answer. Contribution margin is. Subtract every variable cost of a single order from revenue (COGS, outbound shipping, 3PL fulfillment, payment processing, return reserves) and what is left is the cash that actually funds CAC and overhead. A healthy DTC contribution margin sits between 35% and 60%.
Time-bound the LTV the same way. A 60-day LTV sets immediate CAC ceilings and protects cash. A 12-month LTV informs strategy. The textbook 3:1 LTV:CAC ratio means nothing without a timeline attached, and most bootstrapped brands cannot wait 12 months to recoup the loss.
LTV:CAC and payback benchmarks by DTC model
| Model | Healthy LTV:CAC | Payback period | Why |
|---|---|---|---|
| Subscription consumables (skincare, coffee) | 4:1 to 7:1 | Under 90 days | High repeat, recurring revenue compresses payback |
| Fashion / apparel | 2.5:1 to 4:1 | Under 90 days | Moderate repeat, seasonal cycle |
| Durable goods (mattresses, furniture) | 1.5:1 to 2.5:1 | Under 90 days on AOV basis | One-shot purchase, scale comes from AOV not repeat |
| Contribution margin (all models) | 35-60% | n/a | The cash that pays CAC |
Cross-check blended CAC (all marketing spend over all new customers) against paid CAC (ad spend over paid-attributed customers). A widening gap is a brand-strength tell: organic, word-of-mouth, and direct are doing real work. A narrowing gap means the brand has become entirely a paid construct.
The math itself, the formulas and the levers to move each input, lives at contribution margin, CAC and payback, LTV:CAC, cohort curves, LTV, and subscription economics. The audit is the diagnostic surface, not the calculator.
Red flags
- Optimizing on a 12-month LTV without the cash to float 90 days of payback.
- A 1:1 LTV:CAC ratio at scale. Once overhead is factored in, the brand is structurally losing money on every new customer, and no media buying tweak fixes that.
- Flat contribution margin alongside rising CAC. The fastest way to break a DTC brand is to push paid scale while variable costs quietly erode the margin underneath.
Pillar 2: measurement and tracking, the data foundation
In 2026, pixel-only setups are blind to roughly 30% to 50% of conversions. iOS privacy updates, Safari ITP, third-party cookie deprecation, and ad blockers (used by nearly 43% of internet users) have all collapsed browser-side visibility. The platform algorithm cannot optimize toward signal it does not see.
The audit inspects four things in this layer.
Dual deploy. Browser Pixel and server-side Conversions API both firing for the same event. Properly paired, they capture roughly 95% of events. Either one alone leaves massive holes.
Deduplication health. Event IDs must match between Pixel and CAPI so the platform can deduplicate. Purchase event dedup rate has to exceed 90%. SPAs (single-page applications) are the most common offender here, because event-ID rotation between render and send breaks matching silently.
Event Match Quality by event type. EMQ grades how well hashed identifiers map to platform user profiles. Moving Purchase EMQ from 8.6 to 9.3 has been observed to deliver roughly 18% lower CPA and 22% ROAS lift, which is why this metric is worth a careful inspection.
EMQ benchmarks by event type
| Event | Target EMQ | Red flag |
|---|---|---|
| PageView | 4.0 to 6.5 | Under 3.0 |
| Add to Cart | 6.0 to 8.0 | Under 5.0 |
| Purchase | 8.5 to 9.3 | Under 6.0 (algorithm is starving) |
Bot and IVT filtering. EMQ does not measure signal validity. A bot with a well-formatted fake email and IP will score high and teach the algorithm to find more bots. Instagram alone has run an estimated 38% bot traffic in recent quarters. The audit checks for a filter-first tier that strips invalid traffic before enrichment.
Alongside the technical layer, the audit confirms the brand reads MER (revenue divided by total ad spend) as the source of truth and treats in-platform ROAS as a directional input. Platform ROAS is greedy and double-counts across channels by design.
The build details (how to deploy CAPI, normalize PII, handle fbc and fbp cookies correctly) live at server-side tracking. The metric framing sits at MER vs ROAS and paid media metrics. The trust layer continues into attribution and incrementality.
Red flags
- Purchase EMQ under 6.0. The algorithm has nothing to learn from.
- Event-ID rotation breaking deduplication, usually in a Shopify Hydrogen or headless SPA build.
- Daily budget decisions made entirely off Meta or Google's in-platform ROAS dashboard, with no MER reference and no third-party tracking tool (Triple Whale, Northbeam) in the loop.
Pillar 3: creative volume and testing velocity
Once the platform handles targeting, the creative IS the targeting. Meta's own data science teams put creative quality at roughly 56% of campaign outcomes. This pillar audits a production supply chain, not an art department.
The throughput benchmark: a minimum of 5 net-new ad concepts per week. Accounts scaling past $50k to $100k per month in spend should hit 10+ variations per week across distinct hooks, formats, and angles. Top DTC brands test 50 to 100 creatives per month to find three to five scalable winners.
Format mix matters as much as volume. Video gets the budget and the attention, but static images carry roughly 38% to 60% lower CPM in cold prospecting, which drastically cuts the cost of testing. Bespoke video routinely runs $200 to $500+ per asset; modular and subscription production models can drive that toward $10. A healthy account runs a deliberate blend of static, UGC video, and motion graphics, chosen with the math in front of it.
Modular cloning is the multiplier. Strip the first three seconds off a winning ad and bolt five new hooks onto the same proven body. Modular Closets did exactly this and cut CPA by 53% at a 6.8x ROAS by killing bespoke-production bottlenecks. Mindful Chef used modular problem-aware sequencing to slash Meta CPAs by 37%.
Fatigue is a freshness metric, not a vibe. Prospecting frequency above 3 to 4 within a seven-day window, alongside falling CTR, means the creative is cooked and needs to cycle out.
The audit also checks how tests are designed. Twenty unrelated videos shipped at once look like activity and produce no learning. Tests have to isolate a single variable (hook, format, angle, offer) so the win is attributable. Button-color tests are not strategy.
The testing math sits at the testing framework. The thesis behind the production pivot is at creative is the new targeting. Creative direction lives at creative strategy. The production model itself is what the agency offer exists to deliver.
Red flags
- $40k per month on Meta and 8 new ads per month shipped. The brand is losing on velocity alone.
- Twenty unrelated videos uploaded together, with no variable isolated. The reports will tell you what won but not why.
- Aesthetic tests (button colors, gradient hex codes) instead of angle tests. High activity, zero strategic value.
Pillar 4: hook and hold diagnostics
This is the per-asset post-mortem layer. Meta's Andromeda update placed extreme weight on the first three seconds of any video creative, which makes the hook arguably the single most important metric in the account.
Two ratios do most of the diagnostic work.
- Hook rate: 3-second views divided by impressions. Did the ad stop the scroll?
- Hold rate: 15-second views divided by 3-second views (or ThruPlays divided by 3-second views). Did the body deliver on the hook?
Hook and hold benchmarks
| Metric | Platform / segment | Median | Solid | Elite |
|---|---|---|---|---|
| Hook rate | Meta (FB/IG) | 20-28% | 28-40% | 40%+ |
| Hook rate | TikTok | 25-30% | 30-35% | 35%+ |
| Hook rate | Beauty / wellness UGC | 30-35% | 35-42% | 42%+ |
| Hold rate | Meta (15s/3s) | 30-40% | 40-50% | 60%+ |
The benchmarks are the easy part. The diagnostic matrix is where the audit earns its fee.
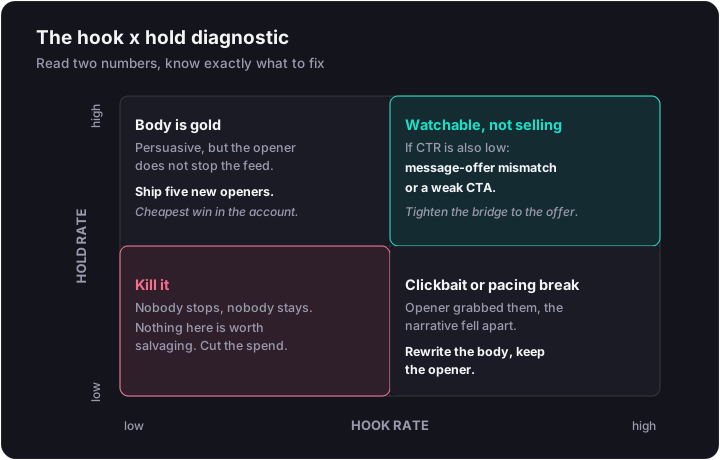
- High hook, low hold. The opener grabbed attention and the narrative fell apart. Either it was clickbait or the transition into the product education breaks. Rewrite the body, keep the opener.
- Low hook, high hold. The content is persuasive but the opener does not stop the feed. Keep the body and ship five new hooks. Cheapest win in the account.
- High hook, high hold, low CTR. Watchable, entertaining, and disconnected from the offer. Message-offer mismatch or a weak CTA. Tighten the bridge.
The point of the section: an auditor who never opens this view is guessing at what to fix. Numbers go out to paid social benchmarks; the creative-direction implications sit at creative strategy.
Red flags
- Optimizing on CTR or ROAS without ever inspecting hook rate. The team has no idea where viewers drop off.
- Average hook rate under 20% on Meta. The CPM penalty kicks in because the algorithm reads the content as feed-irrelevant.
- A creative hitting 43% hook rate by being purely sensational, then converting at terrible ROAS because it disqualifies the actual buyer. Hook chasing is its own trap.
Pillar 5: landing page and offer alignment
A flawless ad account bleeds capital into a misaligned page. The post-click audit walks the top 20 traffic-driving URLs and pressure-tests message match, structure, and mobile experience.
Message match. The hero headline has to mirror the core promise, hook, or text overlay of the ad that earned the click. A mismatch bounces 40% to 60% of visitors in under five seconds.
Dedicated landing pages over homepages. Optimized LPs built specifically for paid social routinely convert 2 to 4 times higher than standard Shopify product detail pages. Homepages, designed for brand exploration, convert paid traffic at roughly 0.8% to 2%.
CVR benchmarks by traffic type
| Traffic type | Healthy CVR | Top quartile |
|---|---|---|
| Paid social to homepage | 0.8-2% | (avoid the pattern entirely) |
| Paid social to dedicated LP | 1.5-3% | 5%+ |
| Paid search to PDP | 2-5% | 5.31%+ |
| Average ecommerce blended | 2.35% | 5.31%+ |
Mobile-first hierarchy. 85%+ of Meta and TikTok traffic is mobile. Load the page on a phone. If the primary CTA is not visible above the fold without scrolling, you are leaving 20% to 35% click-through on the table.
Offer architecture. If the ad promotes a bundle, the LP defaults to the bundle. Forcing the user to assemble the offer themselves suppresses AOV and corrodes the unit economics from Pillar 1.
Trust and urgency placement. Legitimate stock indicators and prominent social proof immediately under the hero. Pages without either suffer 15% to 22% lower conversion.
Intent-segregated funnels. Cold top-of-funnel mobile traffic often needs an advertorial or warm-up before the hard sell. Branded search traffic can go straight to a frictionless PDP. One LP for everything is the wrong answer.
Red flags
- Paid social pouring traffic into the brand homepage. Almost every shop with this pattern is diluting its spend by half.
- Bounce rate above 60-70% within five seconds. Either the message did not match or the page did not load.
- Desktop-first design with a broken mobile checkout (no Apple Pay, no Shop Pay, slow first paint). Mobile CVR will be a fraction of desktop and the gap is not "intent," it is friction.
Pillar 6: account, audience, and placement structure
In 2026, manual micro-interest targeting actively hurts performance. Machine learning systems like Meta's Lattice require data density to predict conversion sequences. Fragmented account structures starve the algorithm.
The audit looks for a hybrid architecture: Advantage+ Shopping Campaigns (ASC) and Performance Max (PMax) for high-volume prospecting with proven assets, and a manual sandbox alongside for testing new creatives, isolating variables, and running specific retargeting. ASC consistently delivers roughly 22% ROAS lift over manual when fed validated creative; PMax averages 10% to 15% higher ROAS than standalone manual Shopping when structured correctly.
Consolidation is the dominant move. Fewer ad sets, more creative each. Kill the $10/day fragmentation; it strands campaigns in the learning phase forever.
PMax needs guardrails. Separate brand and non-brand asset groups, or PMax will funnel budget into branded search (capturing existing demand) and call it prospecting. The audit pulls the PMax channel allocation breakdown to verify this.
Prospecting exclusions get a line-by-line review: past 180-day purchasers, current email subscribers, recent website visitors. If the campaign is supposed to find net-new customers, it cannot also be paid to re-acquire ones the brand already owns.
Phase-appropriate budgeting matters during learning. New creative needs loose CPA targets to gather data, with ROAS goals tightened only after the algorithm validates the signal.
The architectural deep dives sit at Meta account structure, Google Ads structure, and scaling mechanics.
Red flags
- Dozens of $10-per-day ad sets stranded in learning. The structure starves the algorithm of data density.
- The retargeting trap. Dashboard blended 4x ROAS, masking 0.5x on prospecting and 8x+ on a tiny retargeting audience. Without profitable prospecting refilling the funnel, this collapses in a few weeks.
- Dumping untested creative directly into ASC or PMax without validating it in the manual sandbox first. Algorithmic confusion, wasted spend.
Pillar 7: channel mix and incrementality
Diversification is a trap until each channel earns incremental credit. The macro-budget audit checks how spend is distributed and, more importantly, how the brand justifies the distribution.
Meta plus Google is the spine, often split 70% paid social to 30% paid search as a starting ratio. Meta plateaus around $25k to $30k of daily spend before CPA degrades; that is the signal to consider secondary channels, not a wall to push through with brute force.
Channel role, format, and saturation
| Channel | Funnel role | Format | Saturation / threshold |
|---|---|---|---|
| Meta (FB/IG) | Scalable prospecting and retargeting | 60-70% video, 30-40% static | Plateau near $25-30k daily spend |
| Google Ads | High-intent capture | Search, Shopping, PMax | ~70% to Search; expand PMax in 20%+ step-increases |
| TikTok | Top-of-funnel discovery | Native UGC, Spark Ads | $50-100/day per ad group min, $500 campaign min to exit learning |
| YouTube | Mid-funnel consideration | Narrative or educational skippable video | $5-10k initial test budget; scales past $100k/day on broad audiences |
| AppLovin | Direct-response mobile acquisition | Vertical video | ~$20k/day minimum spend; established brands only |
The audit's most important check in this layer is whether the brand runs incrementality tests before crediting any channel. Geo holdouts, exposed-vs-control cells, or full lift studies. Think of it as the billboard test: take the billboard down for a month in one city. If sales there hold steady, the billboard was claiming credit for traffic that was coming anyway, and its budget should be reallocated.
Channels do not operate in silos. A strong TikTok campaign will push Google branded search up days later. If Google claims 100% of those sales and the brand cuts TikTok, the ecosystem collapses. Cross-channel halo is exactly what incrementality testing exists to reveal.
Channel-specific deep dives sit at the channel map, Google Ads, YouTube, native, and paid search vs paid social. The causal-testing methodology lives at incrementality testing, and the measurement framing at MER vs ROAS.
Red flags
- Sum of platform-reported revenue (Meta + Google + TikTok + email) exceeds Shopify revenue by 40%+. Massive double-attribution, almost certain budget misallocation.
- $50k per month spread across five platforms. Universal mediocrity, nothing exits learning anywhere.
- Cutting a channel based on platform-reported ROAS while it is quietly lifting branded search and direct.
The triage order: fix this before that
Most audits surface red flags in every pillar. Attempting to fix all of them at once is how brands stall.
- Unit economics first. If the brand loses money on a 60-day payback, no media buying tweak matters. Adjust pricing, COGS, or shipping thresholds before adding budget.
- Measurement second. Do not evaluate creative or campaigns on broken data. Fix EMQ, fix deduplication, deploy CAPI properly.
- Landing pages third. A 1% lift in LP conversion rate reduces CPA faster than any media-buying hack. Cheaper than buying clicks twice.
- Creative velocity fourth. With clean economics, clean data, and a page that converts, now the production pipeline becomes the lever. Modular cloning, 5-10 net-new concepts per week.
- Account architecture fifth. Only after the pipeline supplies validated assets do you consolidate into ASC and PMax to leverage machine-learning scale.
Each step gates the next. Skipping ahead is how brands spend a quarter "fixing structure" while the EMQ score quietly poisons every campaign.
What the deliverable looks like
The output of a real audit is a doctor's chart for the account, not a 90-slide consultant deck.
- A written diagnosis pillar by pillar, with the specific numbers pulled from the account.
- The red flags surfaced and what each one is currently costing.
- A sequenced fix list (the triage above, applied to this brand's actual situation).
- A creative POV grounded in what the hook and hold data revealed, with concept directions the production pipeline can ship next week.
No generic "best practices." No "consider testing more creative." Specific, ordered, attributable to the account in front of us.
Next step: book the audit
The paid media audit is the entry point of every engagement we run, because there is no honest way to fix what we have not measured. The same seven pillars, the same red-flag screen, the same triage order.
If the diagnosis points to a production-supply-chain problem, the creative agency offer is built to ship the pipeline that fixes it. If the answer is broader, performance marketing services covers the execution layer end to end. And if you landed here mid-fire, why ads stopped scaling is the reactive companion to this proactive review.
Book the audit when scaling has stalled, when MER is drifting, or when the dashboards look fine and the bank account does not.
You
Can you look at our ads?
Want this read on your own ads?
We pull your live ads from the Meta Ad Library, set them next to the longest-running ads in your category, and send back what we'd change and test next. The teardown is free.
Get my free creative teardownWe usually reply within one business day.