MER vs ROAS: Why Your Ad Platform Is Lying to You
The mer vs roas debate is the cleanest tell of whether a DTC founder is running the business or the business is running them. Platform ROAS is a self-graded report card written by the platform that gets paid when the grade is good. MER is your bank account. One inflates by 15 to 40 percent on a normal account and up to 100 percent on a fragmented one. The other cannot be gamed, because the denominator is total marketing spend and the numerator is total revenue.
The Number Your Ad Platform Won't Show You
If Meta says 3.4x and Google says 4.6x and your accountant says you are bleeding, the platforms are not wrong on their own math. They are wrong on the math that matters.
Two definitions and a rule, then we get into the gap.
- ROAS = revenue a platform attributes to itself / spend on that platform. Channel-specific. Modeled. Inflated.
- MER (Marketing Efficiency Ratio) = total store revenue / total marketing spend. Holistic. Attribution-free. Honest.
- Rule of thumb: ROAS is for tactical media-buying decisions inside an ad account. MER is for the decision of whether to push more capital into the business at all.
Brands that scale in 2026 use both, but they only fund growth on MER. Brands that die scale on ROAS and find out months later that the platforms were claiming credit for sales that were already going to happen.
ROAS and MER, Defined
The terms get used loosely, and the confusion costs money.
| Metric | Numerator | Denominator | What it answers |
|---|---|---|---|
| Platform ROAS | Platform-attributed revenue | Spend on that one platform | "Does the algorithm think this channel is working?" |
| Blended ROAS | Total store revenue | Total paid media spend | "Is paid media as a category pulling its weight?" |
| MER | Total store revenue | Total marketing spend (media + agency + tools + creator fees) | "Is the whole marketing machine efficient?" |
| aMER | New customer revenue | Total acquisition spend | "Is acquisition actually profitable, or is retention propping it up?" |
The Blended ROAS vs MER distinction is the one most brands miss. Blended ROAS only divides by paid media. True MER loads in retainers, software, and creator fees so the number reflects the fully loaded cost of growth. If your agency, your Klaviyo bill, and your UGC creator pool are not in the denominator, you are flattering yourself. For the full set of numbers that sit alongside this one, see the broader metric stack.
Why Platform ROAS Lies (The Post-iOS 14 Math)
The inflation is not malice from a single platform. It is a structural feature of how tracking broke in 2021 and what the platforms did to paper over it.
Apple's App Tracking Transparency framework severed the deterministic click trail in iOS 14.5. Opt-in rates stabilized near 25 percent globally. Roughly 70 percent of iOS conversions became invisible to platform-side tracking.
To cover the gap, Meta, Google, and TikTok switched to predictive modeling. The models are sophisticated. They are also written by the company that gets paid when the model says the ads worked. Generous attribution windows (7-day click, 1-day view on Meta) layer on more credit on top of the modeled baseline. The net effect: weak campaigns look healthy in the dashboard, and healthy campaigns look spectacular.
Attribution Overlap and Double-Counting
The fatal flaw is not the modeling. It is the walled garden.
Meta, TikTok, and Google do not talk to each other. A modern purchase journey often touches all three: a Meta brand video on Monday, a TikTok creator click on Wednesday, a Google branded search on Friday to close. All three platforms claim the sale in full. None deduplicates against the others.
The result, according to teardowns of DTC accounts: the sum of platform-reported revenue typically exceeds actual Shopify revenue by 20 to 40 percent. In highly fragmented media mixes, that inflation hits 100 percent. A brand scaling on a platform-reported 4.0x ROAS often discovers their true return is closer to 2.5x once the overlap is removed. For the mechanics of deduplicating credit across platforms, route to the attribution stack.
Revenue Is Not Profit
ROAS has a second flaw that has nothing to do with attribution: it is a revenue metric, not a profit metric. It ignores Cost of Goods Sold, shipping subsidies, payment processing, fulfillment fees, return rates (20 to 30 percent in apparel), and promotional discounting.
One survey found that roughly 67 percent of sub-€10M DTC brands report "strong" ad performance in their dashboards while simultaneously bleeding cash. Scaling top-line ROAS without knowing your contribution margin is the most reliable way to scale yourself into bankruptcy.
How to Calculate MER (and aMER)
The formulas are short. The discipline to actually use them is the hard part.
MER  = Total Revenue / Total Marketing Spend
aMER = New Customer Revenue / Total Acquisition Spend
A brand generating $500,000 in revenue on $125,000 of total marketing spend runs at a 4.0x MER. Every dollar in produced four dollars out. No attribution debate. Put your own store and platform numbers side by side with the MER vs ROAS calculator.
aMER is the strictest honesty test. Standard MER blends new and returning customers, so a brand with a deep email list and high cohort LTV can post a beautiful MER while their paid acquisition campaigns lose money. If your aMER drops below 1.0x while your MER still looks healthy, you are not running a growth business; you are harvesting a back catalogue. For the new customer CPA math that sits underneath aMER, and the cohort LTV that masks it, those numbers belong on their own pages.
What Goes in the Denominator
The expense-categorization rule is the one brands get wrong most often, and it crashes the weekly signal when they do.
- In the weekly MER denominator: direct-response media spend, standard agency retainer, recurring creator/influencer fees.
- Out of the weekly denominator, into a monthly amortization: one-off brand expenses such as a PR stunt, an OOH billboard flight, or a physical retail activation.
Drop a $100,000 billboard spend into a single week's marketing total and the weekly MER will artificially plummet, sending false signals to media buyers to pause campaigns that are actually working. Isolate those expenses, amortize them across the relevant months in the P&L, and let the weekly number do its job.
Reading the Two Together: Cadence and Diagnostics
MER and ROAS are not rivals. They answer different questions on different timescales. The discipline is matching the metric to the cadence.
| Cadence | What you check | What you decide |
|---|---|---|
| Daily | Total sales, order count, platform ROAS for anomalies | Nothing strategic. Pulse check only. |
| Weekly | MER, aMER, NCPA, returning-customer rate, conversion-rate trend | Channel allocation, creative greenlights, scale-up or pull-back |
| Monthly | Full P&L waterfall: contribution margin, CAC payback, true Shopify revenue vs platform-claimed revenue | Budget envelope, hiring, inventory commitments |
The weekly sync is non-negotiable for brands in the $1M to $10M range. Customer behavior shifts too fast for monthly checks to catch. Daily strategic decisions are noise: modeling fluctuations and calendar effects mask the actual pattern.
Diagnostic: High ROAS, Dropping MER
This is the cannibalization tell.
Platforms are reporting strong ROAS, but blended MER is sliding. A weekly MER drop of more than 15 percent that cannot be explained by a holiday or calendar event is the trigger. What is usually happening: paid campaigns are over-indexing on bottom-of-funnel retargeting, branded search, or returning-customer matches from email-pixel handshakes. The platforms are claiming credit for sales that would have happened organically.
The fix is rarely "spend more." It is reallocating away from the campaigns that are double-billing organic demand and toward genuine prospecting.
Diagnostic: Low ROAS, Stable MER
This is the opposite, and it is the more dangerous one to misread.
A specific platform (Meta is the common offender) shows deteriorating ROAS while blended MER stays flat. The platform is carrying top-of-funnel discovery without receiving last-click credit. People are seeing the Meta ad, then searching the brand on Google or arriving direct, and the credit gets assigned downstream.
Shutting off the "underperforming" Meta campaign on the basis of platform ROAS alone collapses site traffic two to three weeks later. Branded search dries up. The "highly profitable" Google brand campaign crashes because there is no demand left to capture. MER drops with it.
The reconciliation benchmark agencies use: aggregated platform-reported revenue and backend Shopify revenue should stay within 15 percent of each other. A gap wider than that means the media buyers are optimizing toward a fabricated reality, and the true causal contribution of each channel needs to be tested with incrementality testing instead of trusted from the dashboard.
Setting Target MER by Margin (Not by Vertical Benchmark)
The advice "aim for 4x ROAS" is the single most expensive piece of generic guidance in DTC. The right number depends entirely on contribution margin, and the formula is plain:
Break-Even MER = 1 / Gross Profit Margin %
A brand at 30 percent gross margin breaks even at 3.33x. A brand at 70 percent margin breaks even at 1.43x. Targets are then constructed as breakeven plus a profit buffer, not pulled from a benchmark blog post written for someone else's business. See breakeven ROAS for the full breakeven walk-through.
Margin Profiles and the Numbers They Tolerate
Compiled from 2026 DTC margin teardowns across categories. Locate yourself by margin, not by what your competitor's MER looks like on a podcast.
| Vertical | Gross margin | Breakeven multiplier | Target blended MER | Target aMER |
|---|---|---|---|---|
| Beauty & Skincare | 75% - 85% | 1.17x - 1.33x | 2.5x - 3.0x | 1.5x - 2.0x |
| Apparel & Fashion | 55% - 65% | 1.53x - 1.81x | 3.0x - 4.0x | 2.0x - 2.5x |
| General DTC | 50% - 60% | 1.66x - 2.00x | 3.0x - 5.0x | 2.0x - 3.0x |
| Supplements & Wellness | High, subscription-anchored | Low | 3.0x - 5.5x | High, LTV-justified |
| Furniture & Home Goods | Moderate, high AOV | Moderate | 1.5x - 2.5x | AOV-justified |
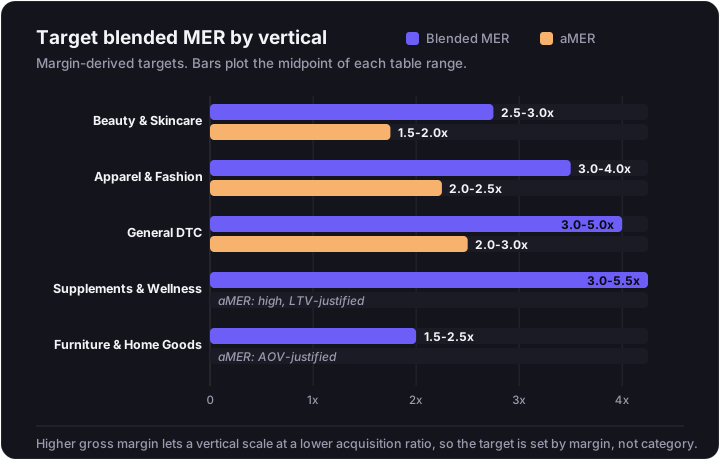
Beauty looks aggressive on aMER because the 75 to 85 percent gross margin lets it scale at acquisition ratios that would bankrupt other categories. Apparel looks better on paper than it is: a 60 percent gross margin gets eaten down to roughly 25 percent net contribution by 24 to 30 percent return rates, so the MER target has to be enforced strictly. Furniture tolerates a 1.5x MER because the AOV does the heavy lifting on dollar contribution per order.
A MER below 2.0x for a typical DTC brand means you are buying revenue at a loss, which is sustainable only if you are venture-funded and have explicitly chosen market share over cash.
Worked Example: Aura Skincare, One Month
Numbers make the gap visible in a way that prose does not. Hypothetical brand, May 2026.
Inputs: - Total revenue: $200,000 - New customer revenue: $80,000 - Total marketing spend: $40,000 ($25,000 Meta, $15,000 Google) - COGS + fulfillment: $60,000 - Gross margin: 70 percent - Breakeven MER: 1 / 0.70 = 1.42x
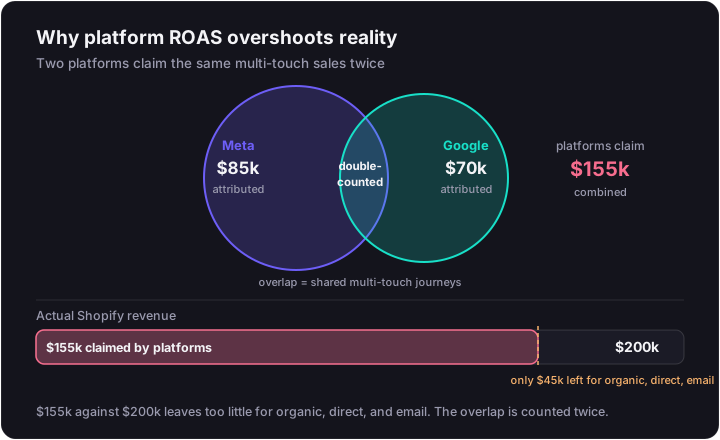
The platform view: - Meta Ads Manager: $85,000 attributed revenue on $25,000 spend → 3.4x ROAS - Google Ads: $70,000 attributed revenue on $15,000 spend → 4.6x ROAS - Sum of platform-claimed revenue: $155,000 - "Blended platform ROAS": $155,000 / $40,000 = 3.87x
This is the fabrication. The two platforms are independently claiming $155,000 of a $200,000 total, leaving $45,000 for organic, direct, branded search, and email. That is mathematically impossible for a healthy DTC brand with a mature retention engine; email and direct alone usually account for far more than that. The platforms are double-counting multi-touch journeys.
The truth view: - MER = $200,000 / $40,000 = 5.0x - aMER = $80,000 / $40,000 = 2.0x
The business is exceptionally healthy (5.0x is well above the 1.42x breakeven). Acquisition is profitable but not heroic: 2.0x aMER is a reasonable acquisition ratio, not the 3.87x the platforms suggested. Retention is doing more of the work than the dashboards admit.
The decision: push more capital into Meta and Google. MER has substantial headroom above breakeven, the retention engine can absorb a temporary dip in tactical ROAS, and the front-end aMER is positive enough that net-new customers will pay for themselves before the back-catalogue carries them.
The brand that reads only the platform ROAS would either over-celebrate (the 3.87x is fake) or, after a fatigue cycle, pause campaigns when ROAS dips and watch MER collapse two weeks later as branded search dries up.
The Dashboards That Make This Operable
Tooling is downstream of methodology. Spreadsheets work for understanding the math; they break at scale because of data latency, manual reconciliation, and human error. Three platforms cover most of the market.
| Platform | Best for | Starts at | Scope | Anti-use case |
|---|---|---|---|---|
| Triple Whale | Shopify-native brands wanting fast multi-touch attribution and a Founders Dashboard view of Net Profit, Blended ROAS, NCPA, and MER in one screen | ~$129/mo (GMV-tiered, scales to $1,849+/mo at $10M+ GMV) | First-party "Triple Pixel," Compass framework, Moby AI | WooCommerce/BigCommerce brands; sub-$10k/mo spend startups who cannot justify GMV pricing |
| Statlas (Common Thread Collective) | Brands wanting financial discipline: daily contribution margin, inventory health grading, formal P&L forecasting | $1,500 onboarding + $500/mo for "PE Lite" | Hierarchy-of-metrics architecture, contribution margin at the apex, plotted actuals vs forecast | Teams seeking real-time tactical click-path attribution rather than long-horizon business modeling |
| Northbeam | Enterprise brands with complex, omnichannel attribution and long consideration cycles | ~$1,000 - $1,500/mo (Starter, under $1.5M spend) | Multi-touch modeling, deterministic + clicks, advanced Marketing Mix Modeling | Brands under ~$20k - $50k/mo in media spend; the statistical models lack data volume to produce reliable estimates |
The specific software matters less than what it forces you to do. The goal of any modern dashboard is to make scaling decisions mathematically accountable to total contribution margin, not to platform pixels. Underneath any of these sits a server-side tracking data layer; without it, the dashboard inherits the same broken signal the platforms have.
Common Mistakes That Wreck the Signal
A short list of the patterns that turn the methodology back into noise.
- Scaling on platform ROAS while MER quietly slides. The dashboard tells you the campaigns are winning; the bank account disagrees.
- Killing a "low ROAS" channel that was carrying discovery. Top-of-funnel work rarely gets last-click credit. Cutting it crashes the channels downstream of it.
- Watching MER daily and reacting to noise. The meaningful signal is weekly. Daily reads are pulse, not direction.
- Comparing to a generic 4x benchmark instead of the margin-derived breakeven. A 4x target is overkill for beauty and a death sentence for low-margin apparel.
- Confusing MER with aMER. A healthy MER on the back of a deep email list can hide a paid acquisition engine that loses money every time it runs.
- Mixing one-off brand spend into weekly MER. A billboard, a PR stunt, or a retail activation will crater the weekly ratio and trigger panicked pauses on profitable campaigns.
Where MER vs ROAS Fits in the Bigger Stack
These are two metrics inside a larger system. The full set of paid media metrics gives you the supporting layer (CPM, CTR, hook rate, CPA, contribution margin per order). Attribution is the methodology that produces defensible per-channel numbers in the first place. Incrementality is the causal layer that proves a channel is actually adding revenue rather than recording it. And paid social benchmarks tell you whether your numbers land in a plausible band for your category before you set a target.
What to Do This Week
Three moves, in order.
- Pull your last 30 days of total revenue and total marketing spend, and compute MER and aMER yourself. Pen and paper is fine. The point is to see the gap between what your platforms told you and what the math says.
- Calculate your breakeven MER from your gross margin. One divided by your margin percent. Now you have a floor that is yours, not a benchmark borrowed from a brand with different unit economics.
- Reconcile the sum of platform-attributed revenue against your Shopify backend. If the gap is wider than 15 percent, your media buyers are optimizing toward a fabricated reality and your scaling decisions are running on bad data.
If that reconciliation is wider than 15 percent, or if you can't yet calculate aMER cleanly because the data is fragmented across platforms and spreadsheets, that is the diagnosis we run inside a paid media audit, and blended MER stays the check our paid media service reports against afterward. It is also the most common root cause behind ads that stopped scaling for reasons no one in the account meeting can explain.
You
Can you look at our ads?
Want this read on your own ads?
We pull your live ads from the Meta Ad Library, set them next to the longest-running ads in your category, and send back what we'd change and test next. The teardown is free.
Get my free creative teardownWe usually reply within one business day.