
In 400 active US Meta ads we coded in July 2026, UGC vs studio ads is a survival dead heat: 61.2% vs 60.0% past 90 days. Each style still does a distinct job, and the data assigns each one.
Three creative styles, three jobs, and 400 ads that sort them
We coded 400 active US Meta ads across five DTC verticals. UGC-style creative runs 77.6% of the video ads brands actually ship, and it survives 90 days at the same rate as studio (61.2% vs 60.0%). Equal survival at a fraction of the cost per asset makes UGC the efficient volume engine. Studio holds a niche (apparel and the year-plus evergreen tail); static is the cheap churn layer that dies fastest.
Three formats. Three jobs. UGC is the volume engine that carries most video and matches studio's survival rate at a fraction of the per-asset cost. Studio is the niche play: it owns apparel and the year-plus evergreen tail. Static is the majority-by-count churn layer, cheapest to make and fastest to die.
The frame is the 90-Day Test: any active Meta Ad Library ad past 90 days counts as a winner, because advertisers kill losers and three months of continuous delivery is three months of someone paying for performance.
The survivor rate is unweighted, since the public Ad Library exposes no commercial spend. Parity is therefore the conservative read for UGC, not the flattering one.
That division of labor is why UGC carries paid social on most DTC accounts; the wider industry numbers tell the same story from the outside.
The three numbers that matter
- 77.6% of coded DTC video ads on Meta are UGC-style (121 of 156). The scale lead.
- 61.2% vs 60.0% ninety-day survivor rate, UGC vs studio. Parity, at a fraction of the per-asset cost.
- 28.6% vs 9.1% share of ads running 365+ days, studio vs UGC. Studio owns the evergreen tail.
Source for all three: Chance Ecom analysis of 400 active US Meta ads, July 2026.
The volume vote: UGC is the working default
UGC is 77.6% of coded video ads and 77.9% of the video survivors, a 0.3 point delta. Winners look exactly like the market.
This is not a recency artifact. Among videos started in the last 90 days, UGC's share is 77.0%; among videos 90+ days old, it is 77.9%. The mix is stable young to old, so an adoption surge is not doing the work.
Studio is the deliberate minority: 35 of 156 coded video ads. A merely-trendy format would get killed faster and survive worse. Read the market vote as a signal, then handle the craft that separates a winning working default from the noise.
The dead heat, read as efficiency
Style is not a survival tiebreaker between the two video classes. The gap is 1.2 points; the medians are 118.0 vs 117.0 days.
| Class | n | Survivors | 90-day survivor rate |
|---|---|---|---|
| UGC | 121 | 74 | 61.2% |
| Studio | 35 | 21 | 60.0% |
| Static | 215 | 110 | 51.2% |
The two video classes are within 1.2 points; static trails by roughly 10.
Equal survival at a fraction of the per-asset cost means UGC buys more shots on goal from the same budget. Parity is a UGC efficiency win, not a draw and not a survival advantage. The label on the brief is not the thing doing the work; the price per variant is.
These are survival numbers, not CPA numbers. Cross-reference the third-party numbers for the wider economics.
The vertical each style owns
Vertical moves survival far more than style does. Beauty-skincare to apparel is a 21.3 point spread (66.3% to 45.0%), several times the 1.2 point style gap. Benchmark against your vertical, not against a generic UGC benchmark.
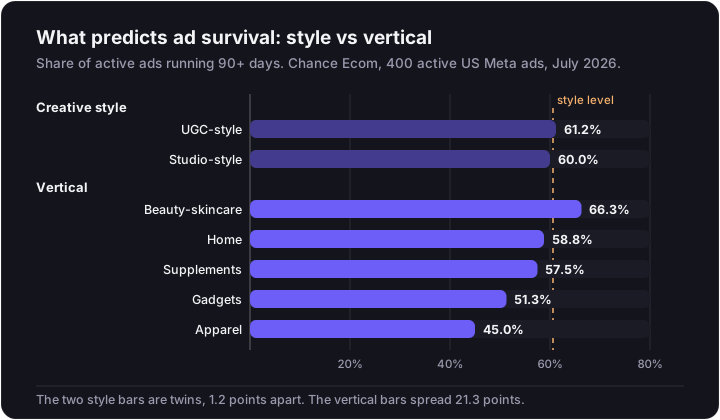
| Vertical | n | Survivors | Survivor rate |
|---|---|---|---|
| Apparel | 80 | 36 | 45.0% |
| Beauty-skincare | 80 | 53 | 66.3% |
| Gadgets | 80 | 41 | 51.3% |
| Home | 80 | 47 | 58.8% |
| Supplements | 80 | 46 | 57.5% |
In apparel, production value earns its keep and studio (70.0%) nearly doubles UGC (36.8%). In beauty-skincare, UGC (81.5%) is the single strongest cell in the study while studio comes in at 50.0%.
| Vertical | UGC survival (n) | Studio survival (n) |
|---|---|---|
| Apparel | 36.8% (19) | 70.0% (10) |
| Beauty-skincare | 81.5% (27) | 50.0% (4, small-sample) |
Gadgets, home, and supplements each have fewer than 10 studio ads in the sample, so they are excluded from the flip read. Each style owns a category. Pick the style your vertical rewards, not the one your feed rewards.
Studio's second slot: the evergreen tail
The median studio ad dies about as fast as the median UGC ad (117.0 vs 118.0 days). Studio's winners run far longer.
| Class | Median days | Mean days | Survivor median days |
|---|---|---|---|
| UGC | 118.0 | 163.2 | 186.5 |
| Studio | 117.0 | 313.9 | 278.0 |
| Static | 93.0 | 152.6 | 169.0 |
Studio's mean (313.9) sits well above its median (117.0) because a fraction of its winners hold a slot for a year plus.
| Class | <90 days | 90-364 days | 365+ days |
|---|---|---|---|
| UGC | 38.9% | 52.0% | 9.1% |
| Studio | 40.0% | 31.4% | 28.6% |
| Static | 48.8% | 41.9% | 9.3% |
28.6% of active studio ads have been running a full year; only 9.1% of UGC ads have. Studio winners become long-haul evergreen assets: brand films, polished demos, category-shaping spots that get amortized over a year of delivery. UGC winners get retired on the refresh cadence creative fatigue forces, which is a creative pipeline problem, not a survival problem.
One long-haul studio winner amortizes differently than a hundred UGC winners. Both are valid. They are different bets, and a rotation with both hedges better than either alone.
The static layer
Statics (single images and carousels) are 215 of 400 ads, 53.8% of the sample, and the majority format by count. Their survival is 51.2%, roughly 10 points behind either video class; the median is 93.0 days.
Half the active ads on Meta are not video at all. Manage statics as a deliberate high-churn layer: cheapest to make, faster to die, priced accordingly. Do not drift into them as a strategy.
What this means for your creative mix
- Default to UGC-style for volume testing. It is the market's working format, matches studio on 90-day survival, and costs a fraction per variant, so the same budget buys more shots on goal.
- Keep a deliberate studio lane. The evergreen tail is real, some verticals (apparel especially) reward production value, and a single long-haul studio winner amortizes over a year of delivery.
- Manage statics as the cheap churn layer, never the default the calendar drifts into.
- Set expectations by vertical before judging any single ad. Survival swings 21.3 points across the five we sampled.
The bigger call is the mix, not the format. Building the paid-social engine is where those three roles get scheduled together, and the worth-it decision is where you check whether the mix pays for your specific brand.
The 90-Day Test: how to run it on any competitor
The framework is short. Pick any active ad in the Meta Ad Library; if it has run 90 or more days, treat it as a winner. Advertisers kill losers, so three months of continuous delivery is three months of someone paying for performance.
Why 90 days. Long enough to outlive testing budgets and honeymoon delivery. Short enough to catch current creative, not the last brand campaign. Days-live is the one performance proxy visible from outside an ad account.
How to run it on a competitor in three steps:
- Find the advertiser in the Meta Ad Library.
- Sort their active ads by start date.
- Study only the ads that have passed the 90-day mark. Everything younger is testing; everything older is the working library.
How the ads were coded (methodology)
- Sample. 400 active US Meta ads pulled from the Ad Library, capture date 2026-07-19. Five DTC verticals at 80 ads each (apparel, beauty-skincare, gadgets, home, supplements), max 3 ads per advertiser, 270 advertisers in total.
- Winner proxy. Days-live equals ad age at capture; 90+ days counts as a winner.
- Video classification. Every video coded UGC-style vs studio-style on a seven-dimension rubric; the class with more scored dimensions wins.
- Static gate. Any non-video (single image or carousel) codes static and is not coded on the UGC/studio axis. A video of any length is never static.
- Class counts. 121 UGC, 35 studio, 215 static, 29 video ads removed before download (disclosed attrition; those 29 had a 62.1% survivor rate, so excluding them does not flatter the headline parity).
- Review. Automated classification with human oversight: over 10% of labels were independently spot-checked, and 2 boundary cases were human-resolved.
- The fake-UGC rule (stated openly). Creator-style content shot by the brand codes UGC. The study measures creative style, not production origin; UGC here means UGC-style, not verified independent creator.
- Framing disclosure. The sample is active ads only, so survivor share reflects the age structure of currently-running ads.
The seven dimensions, verbatim, so any ad can be audited against them:
| Dimension | UGC markers | Studio markers |
|---|---|---|
| Presenter | Person talking to camera, self-presenting | No on-camera speaker, or talent staged within a scene |
| Camera | Handheld or phone-in-hand: shake, arm's-length selfie angle, mirror shots, walking or car shots | Locked-off, tripod, gimbal, or dolly stability; composed moves |
| Setting | Real lived-in spaces: home, bathroom, car, bedroom, street | Set, seamless or graphic background, controlled staged environment |
| Lighting and grade | Available light, mixed color, phone-camera exposure | Controlled lighting, professional color grade, consistent skin tones |
| Overlays | Native-app caption style (TikTok/IG text, auto-caption blocks, sticker fonts) | Motion graphics, animated brand type, lower-thirds, end-card logos |
| Editing | Jump cuts, unpolished trims, single-take stretches | Rhythmic cut patterns, transitions, b-roll inserts, product macro shots |
| Audio | On-camera speech, room tone, first-person testimonial address ("I tried...") | Voiceover over b-roll, licensed-track-driven edit, sound design |
What this study cannot tell you
- No cost, CPA, ROAS, or CTR claims. This measures survival of active creative, not economics.
- Style, not origin. A brand-shot "fake UGC" ad codes UGC because the study tracks the observable creative choice, not who filmed it.
- Active-ads-only sample, one capture date, US only, five verticals. No historical time series and no international generalization.
- The spend-weighting limitation. The survivor rate is unweighted; every ad counts once regardless of spend, and the public Ad Library exposes no commercial spend. Do not read parity as a claim that any class spends more or sits higher on the page; that is unverifiable. The defensible direction: because the parity is unweighted, it is the conservative read for UGC. An efficiency-weighted view would, if anything, favor the cheaper-per-asset format further. Parity is a floor on the UGC efficiency case, not a ceiling.
Two zombie stats come up whenever UGC data circulates.
- The "$18.68 average DTC CPA" number traces to a 2016-2017 WordStream study of 256 ad accounts, roughly a decade old. Unverifiable as a current DTC benchmark; not requoted. This study has no cost data to replace it.
- The "UGC gets 4x the CTR of brand content" claim circulates with no traceable primary source we can find. Unverifiable, not repeated. This study measures survival, not CTR, and it finds no UGC-vs-studio survival gap.
Build the mix, per vertical
UGC scales. Studio holds the niche. Static covers the churn layer. The edge is not a single format, but the deliberate mix, built for your vertical and your funnel.
That per-vertical calibration is where a creative partner earns its keep: matching the style your category rewards, keeping enough studio in the rotation to feed the evergreen tail, and running statics as a managed cheap layer rather than a default. Talk to us about how we build the paid-social mix against 90-Day Test data, or run the worth-it math for your brand first.