
UGC by the numbers in 2026
Across the most reliable 2025-2026 studies, UGC delivers roughly a 30-50% lower CPA than studio creative on paid social, a measurable click-through edge, and a median 18% page-level conversion lift on product pages with reviews installed. The catch: most quoted "144%+ lift" headlines measure engagers only, not all visitors, and the page-level reality is much smaller.
What follows is a sourced, methodology-flagged reference. Every number is a third-party finding with its underlying study named, with one flagged exception: our own 400-ad Meta analysis, cited as first-party where it appears. Where a widely repeated stat has no traceable primary source, we cut it rather than requote it. Use this page for decks, internal memos, and investor questions where the wrong denominator can sink a forecast.
How to read these numbers (the methodology gotcha)
Most UGC stat lists conflate two completely different denominators and inflate impact. Before you quote anything below, hold the distinction:
- Page-level methodology. Measures every visitor to a page with UGC vs an identical page without it. Site-wide reality. Spiegel Research Center and Idukki's A/B benchmarks use this. The honest number for forecasting.
- Engager-only methodology. Measures only the shoppers who clicked a photo, expanded a review, or sorted by recency, and compares them to passive scrollers. Mathematically real but selection-biased. Bazaarvoice and PowerReviews vendor decks usually report this.
The kicker: vendor decks routinely cite +144% to +161% engager-only lifts, while the same Idukki A/B aggregation across 2,400 programs lands the median page-level lift at +18%. Both are real. They answer different questions. Every stat below carries a reliability tag using this frame, so route each one to the right PDP conversion question.
| What the number measures | Typical lift cited | Reliability for forecasting |
|---|---|---|
| Page-level (every visitor, A/B controlled) | +18% median CVR (Idukki, 2,400 programs) | High. Use for financial models. |
| Engager-only (self-selected clickers vs passive scrollers) | +144% to +161% (Bazaarvoice, PowerReviews) | Low for top-line forecasting. Use to justify UI placement. |
Consumer trust and authenticity
The stats that explain why UGC moves the metrics downstream. One provenance note first: several of the most-quoted trust numbers here (the 79%, the 2.4x, the 9.8x) trace to the same Stackla consumer survey, now part of Nosto. It predates 2025, so read them as durable attitudes, not fresh 2026 data. The famous "92% trust peer recommendations over ads" figure is a Nielsen finding now more than a decade old; it still headlines UGC decks, but we treat it as history rather than a current benchmark, so it is not in the list below.
- 54% of shoppers now trust online reviews more than personal recommendations from friends and family (24%). 2026 consumer survey. A generational shift in the social-proof hierarchy.
- 79% of shoppers say UGC has a "high impact" on purchase, vs 13% for brand content and 8% for traditional influencer marketing. The clearest single quantification of the trust gap.
- Consumers rate UGC 2.4x more trustworthy than professional brand content. Imperfect lighting, varying body types, and unscripted audio read as evidence of reality.
- UGC is 9.8x more impactful than influencer content for purchasing decisions. Nosto, Stackla, and Forrester aggregate.
- 60-68% of consumers identify UGC as the most authentic content format. Only 8% say celebrity or social-media influencer content impacts their purchase.
- Shoppers actively seek out negative reviews before buying. They read "flaws" as evidence the review set is real. Survey estimates of the exact share vary too widely to quote one number.
- 41% of 18-34 year olds now use generative AI for product search; 75% of that cohort trust AI-curated recommendations. Bazaarvoice 2025 Shopper Experience Index, ~8,000 global consumers.
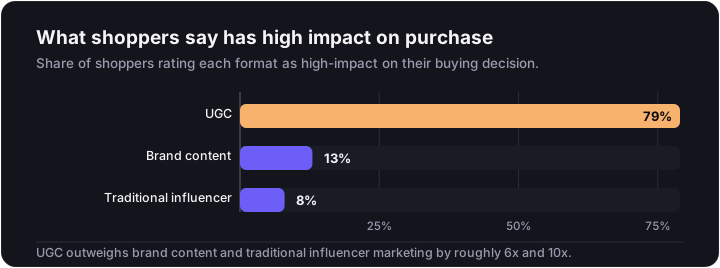
For the UGC vs influencer comparison in context, the 9.8x finding does heavier lifting than any single ROAS chart.
Conversion lift on product pages
The canonical PDP stats. Read the academic baseline first, then the page-level A/B data, then the engager-only figures with the reliability flag applied.
- Products with 5 reviews have a 270% higher purchase likelihood than products with zero reviews. Northwestern's Spiegel Research Center: 57,000 anonymous + 65,000 verified reviews across 13,500 products, 22 CPG categories, 15.5M page views. The most rigorous baseline in the literature, academic and controlled.
- Higher-priced products see a 380% review-driven conversion lift; lower-priced products see 190%. Same Spiegel study, split by median item price. Conversion lift is price-elastic with consumer risk.
- Verified-buyer reviews lift purchase likelihood an additional 15% over anonymous reviews. Spiegel hierarchy-of-trust finding.
- Purchase likelihood peaks at 4.0-4.7 stars and decreases toward a perfect 5.0. A flawless rating triggers fraud suspicion.
- Conversion rate rises ~5% for each additional star between 3.5 and 4.5 (Amazon sales-data analyses).
- Median page-level conversion lift from UGC on a PDP is +18%, aggregated across 2,400 A/B programs (Idukki). The single most defensible number for financial forecasting.
- UGC creative on a PDP delivers a +29% conversion advantage over brand-produced creative in the same slot. Idukki's 2,000-PDP, four-month A/B with 30,000-session minimums per variant.
- PDPs with customer reviews see a 354% conversion-rate increase vs identical pages without (Bazaarvoice), though the methodology is not stated as page-level versus engager-only.
- Shoppers who actively interact with UGC convert 100.6-102.4% higher than the site average (PowerReviews, 1.5M PDPs), though that is an engager-only figure, better for prioritizing UI than for forecasting.
- Interacting with "Helpful Yes" votes correlates with up to a 356.3% conversion lift; sorting by "Most Recent" correlates with 171.9-196.4% lifts. Both are engager-only, better for UI prioritization than forecasting.
- Video reviews carry 4.1x the conversion impact of text-only reviews on the same SKU (PowerReviews).
- Replacing static hero images with shoppable 9:16 customer video generates a median +27% CVR uplift (Idukki, 2,400 brand implementations).
- Integrating customer videos can lift conversion by up to 80% (Skeepers).
- 53% of shoppers usually seek visual proof before buying; ~25% refuse to purchase without first consulting customer videos or photos (Deloitte / Bazaarvoice).
For the PDP placement mechanics behind these numbers, route to UGC on product pages.
Conversion lift by vertical
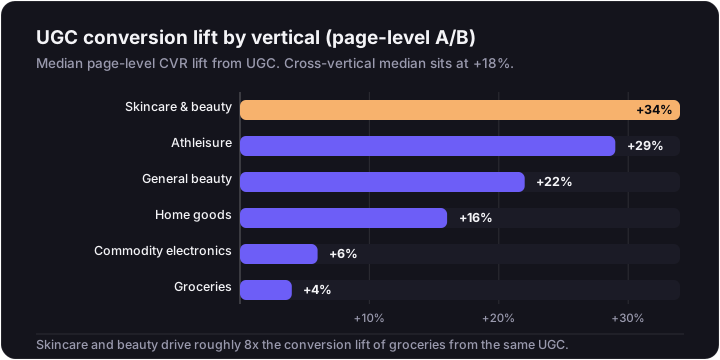
"X% lift from UGC" is meaningless without naming the vertical. Skincare and beauty drive roughly 8x the CVR lift of commodity electronics.
| Vertical | Median page-level CVR lift | Sensitivity | Note |
|---|---|---|---|
| Skincare & beauty | +34% | High | Leads the industry. Metadata tagging by shade and undertone amplifies further. |
| Athleisure | +29% | High | Visual fit and on-body context drive purchase. |
| General beauty | +22% | Moderate | Tone- and skin-type matching matters. |
| Home goods | +16% | Moderate | Real-room context outperforms studio sets. |
| Commodity electronics | +6% | Low | Subjective peer variance is narrow. |
| Groceries | +4% | Low | Standardized goods rarely benefit from peer photos. |
Source: Idukki 14-vertical benchmark, page-level A/B methodology. The cross-vertical median sits at +18%. For why beauty leads, see the PDP page and its metadata-tagging breakdown.
UGC ads on paid social: the performance deltas
The paid-social benchmarks. The aggregates here pull from Benly.ai (1.1M ads across 1,600 brands, 12,000+ coded video ads), GrowthBoss (Q1 2026, 400 DTC brands), Meta and TikTok internal studies, and several mid-size platform datasets.
| Metric | Typical UGC direction vs studio | Source | Reliability |
|---|---|---|---|
| Hook rate (3-sec view) | 34% UGC vs 26% studio (+30.7% relative) | Benly.ai, 12,000+ ads | Well-sourced |
| Hold rate | +35% to +134% | Aspire 2025; Digital Applied Q1 2026 | Well-sourced |
| CTR | +33% (Meta UGC 1.88% vs studio 1.41%) | Benly.ai; Meta internal 2024 | Well-sourced. The circulating "2-4x" version has no traceable primary; not repeated here. |
| CPM | Up to -54% when the hook holds | GrowthBoss Q1 2026, 400 DTC brands | Well-sourced |
| CPC | -31% to -50% | Aspire; ShortGenius; LaunchpointHQ | Well-sourced |
| CVR | +44% (typical median) up to +673% (ceiling) | Digital Applied 2026; GrowthBoss Q1 2026 | The 6.73x is a ceiling, not a median |
| CPA | -23% to -50% | LaunchpointHQ; Benly.ai prospecting data | Well-sourced |
| ROAS | +26% to +62% (top of range is founder-led) | Reelbase 2026; MHI Media 2026 | Well-sourced |
One widely shared number is deliberately missing from that table. The "UGC gets 2-4x the CTR of brand ads" claim shows up in nearly every stats roundup, but we could not trace it to a primary study, so we do not repeat it. What we can report first-hand: our own analysis of 400 active US Meta ads (Chance Ecom, July 2026) found UGC-style creative is now 77.6% of DTC video ads, while ninety-day survival is a dead heat, 61.2% for UGC vs 60.0% for studio. The full 400-ad study breaks down what actually predicts a long-running ad.
Two qualifiers worth naming. TikTok Spark Ads carry a 38% CPC premium ($1.41 vs $1.02) despite higher CTR, driven by creator-rights fees and concentrated-intent auction dynamics under GMV Max bidding. And a hybrid ~60/40 UGC/studio mix typically beats either format alone by 18-25% on blended ROAS (Benly.ai). The strategic argument lives at UGC ads on paid social; the craft side lives at UGC video ad anatomy.
Engagement and the algorithmic discount
- UGC consistently out-engages brand-created content, which feeds back into cheaper delivery via Meta's Ad Relevance Diagnostics. The exact multiplier varies by study; the widely shared "6.9x more engagement" figure has no traceable primary, so we do not quote it.
- TikTok Spark Ads deliver a 134% higher 6-second view rate and a 35% higher overall watch-through rate vs polished in-feed (Aspire; Digital Applied; TikTok internal).
- TikTok Spark Ads carry a 2.6% CVR vs 1.8% for standard in-feed (+44% lift), per TikTok internal data.
- UGC creative on TikTok outperforms polished brand creative by 2-3x in conversion (Pixis).
For the channel split, see TikTok vs Meta; for the licensing mechanic, see Spark Ads vs Partnership Ads.
Founder-led ads: the strongest UGC sub-category
Founder-to-camera has emerged as the highest-ROAS UGC subcategory. MHI Media's analysis is the most-cited source.
- Founder-led ads achieved a 2.7x higher CTR than traditional brand ads (MHI Media, 1,200+ campaigns).
- Founder-led CPA is 31% lower than standard UGC and 47% lower than studio.
- Founder-led ROAS is 31% higher than UGC and 62% higher than studio.
- In trust-dependent verticals, founder ads sharply outperform UGC: Skincare 340% vs 180% ROAS (+89% gap), Supplements 380% vs 190% (+100% gap), Tech 290% vs 160% (+81% gap). Analysis of 500+ DTC ad accounts.
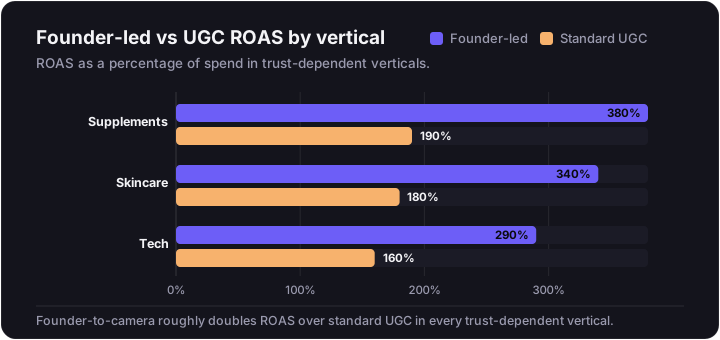
Founder-led fits inside the wider paid-social UGC strategy and shows up as a specific hook archetype on the video ad craft page.
Revenue per visitor and AOV
The AOV side compounds with CVR into Revenue Per Visitor. CFOs ask for these.
- Idukki's 2026 benchmark report (over £400M attributed revenue, 14 verticals) finds a median +22% AOV lift from UGC.
- Combined with the +18% page-level CVR lift, median Revenue Per Visitor lift lands at roughly +44%.
- Adding a "wear it your way" UGC strip on PDPs delivers a median +9% AOV lift (Idukki).
- Yotpo: customers interacting with reviews and user photos at swimwear brand Cupshe show a 10% higher AOV. Outdoor brand Dakine lifted AOV 20% from PDP UGC. Both are brand-attributed vendor case studies, so treat them as directional.
- TurnTo Networks (now Yotpo): integrating UGC into the final checkout experience can lift AOV up to 2.4x, though that is a single-vendor figure with unclear methodology.
- Bazaarvoice: shoppers who engage with ratings and reviews on best-in-class sites see a 154-162% RPV increase, though that is an engager-only figure, better for UI prioritization than for forecasting.
The PDP mechanics that drive these lifts sit at UGC on product pages.
Operational thresholds: how much UGC, how often
The "is one good video enough" question. No.
- A PDP needs 20+ pieces of UGC per SKU to establish baseline communal consensus (Idukki).
- UGC must be refreshed weekly: 90% of consumers (n=19,000) regularly consider review recency (PowerReviews).
- 73% of variance between high- and low-performing UGC programs is explained by three operational factors: volume (20+ assets/SKU), placement (above fold or sticky), and freshness (weekly cadence). Idukki.
- Lower-priced products need only 2-4 reviews to trigger statistically significant conversion lift; higher-priced products need 5+ (Spiegel).
- All meaningful conversion lift from review volume is captured within the first 10 reviews; the first 5 drive the bulk (Spiegel).
Creative fatigue and ad lifespan
The single biggest planning miss for DTC brands is underestimating UGC ad fatigue velocity. The lifespan and volume figures here are practitioner-reported norms, not controlled studies; trust the direction more than the digits.
- Average UGC ad lifespan before 20% performance degradation: 10-14 days on Meta, 5-7 days on TikTok.
- To maintain performance, DTC brands typically ship 20-50 new UGC variants per week.
- A hybrid ~60/40 UGC/studio mix typically outperforms either format alone by 18-25% on blended ROAS (Benly.ai).
That volume implies a system, not a freelancer. See creative pipeline for what the ship rate actually looks like.
What UGC costs in 2026
Pricing benchmarks from market surveys and platform rate cards. Each line is one number per role, no commentary.
- Median 2026 base rate for a single 15-60s organic UGC video: $150-$175. Mean is higher ($198-$212) because premium creators skew the data.
- Per-video rate by tier: Beginner $75-$300, Intermediate $300-$800, Experienced/Pro $800-$3,000+.
- A 5-video bundle typically carries a 15-20% volume discount vs standalone pricing.
- Paid-media usage rights add 30-75% to the base rate for a 30-90 day window; perpetual buyouts add 100-150%.
- Whitelisting / Spark Ads access adds 30-100% to the base rate per month.
- Raw footage delivery adds a 30-50% premium.
- Hook-only variations: $50-$100 per 3-second hook from a human creator; AI alternatives at $29-$99/month flat.
- Niche multipliers: Beauty/fashion $150-$400, Pet and F&B $100-$250, Fintech $300-$600, Health supplements $79-$700+ (credentialed practitioners at the top), B2B SaaS $1,000-$3,000+.
- The global UGC market: $4.45B (2024), $7.62B (2025), projected $18.6B by 2031, ~27% CAGR (industry report).
- Studio production day-rate context: a single 12-hour commercial day commonly runs $10,000-$18,000 all-in. Equivalent UGC volume: 50-100 distinct variants.
For the full breakdown by deliverable and licensing line, see UGC pricing and platforms vs agency.
UGC vs influencer marketing, by the numbers
- UGC is 9.8x more impactful than influencer content for purchasing decisions (Nosto, Stackla, Forrester aggregate).
- Only 8% of consumers report celebrity or social-media influencer content impacts their purchase decisions.
- Whitelisting / Partnership Ads / Spark Ads typically cut CPA 30-50% vs standard brand-handle ads.
For the full compare, see UGC vs influencer marketing.
AI UGC: the early 2026 numbers
Everything in this section is vendor-sourced; read it as directional, not benchmark-grade.
- AI UGC tools have driven cost-per-variant under $15 for sub-$50 impulse products, with brands generating 50+ video hooks per day at a fraction of human-creator cost.
- AI-generated UGC is currently matching or outperforming human UGC on cold traffic for sub-$50 impulse categories, driven by high-volume multivariate testing.
The POV on where AI UGC works and where it backfires sits at AI UGC; the named-tool comparison sits at AI UGC generators.
Email and retention extensions
UGC outside the ad and PDP.
- Injecting UGC into abandoned-cart flows: +2.4x CTR vs the standard reminder template (Idukki).
- A "wear it your way" UGC block in post-purchase confirmation emails: +24% repeat-purchase rate (Idukki).
- Win-back campaigns using fresh UGC from the last 60 days: 31% reactivation rate (Idukki).
How to cite these stats
When you quote any of the above, name the underlying source (Spiegel Research Center, Idukki, Bazaarvoice, PowerReviews, MHI Media, Benly.ai, Aspire, Digital Applied, Yotpo, Skeepers, Deloitte) rather than this page. The one first-party exception: the survival numbers are ours, cited as Chance Ecom's analysis of 400 active US Meta ads, July 2026. In financial models, flag the methodology: page-level for forecasting, engager-only for UI placement arguments. Skip the perfect-5.0 fallacy. Stats stale fast here; treat anything older than 2025 with extra skepticism, and re-check vendor numbers against an independent A/B benchmark before they reach a CFO.
When the numbers should make you act
The aggregate signal is unambiguous. UGC is not optional for a DTC brand running paid social, and the operational thresholds (20+ assets per SKU, weekly refresh, 20-50 ad variants a week) require a system, not a freelancer. If your current pipeline ships one video a fortnight, the benchmarks above describe a category you are not in.
That pipeline is what we build. See how we produce UGC ads for the offer, or is UGC worth it if you want to qualify yourself first.