
Most DTC brands are still reading customer acquisition cost off the Meta dashboard and treating that number as a business metric. It is not. It is roughly half of what the CFO sees once retainer, creative, software, and fractional payroll get added back, and the gap is wide enough to flip a scale decision the wrong way every time.
A wrong CAC produces a wrong scale decision, every time. Below: the four CAC formulas that actually matter, the specific lie each one tells, and the payback period that caps how fast you can spend.
What Customer Acquisition Cost Actually Is (and Why the Number You Quote Is Wrong)
Customer acquisition cost is the fully loaded spend it took to land one net-new customer. The right formula is Total Fully-Loaded S&M Spend / Net-New First-Time Buyers.
Anything that divides ad spend by total orders is a CPA, not a CAC. CPA is a media metric the ad platform reports. CAC is a business metric your P&L cares about.
The gap between the two is not a rounding error. Brands that calculate CAC strictly from direct ad spend understate their true acquisition cost by 40 to 60 percent. Four flavors of CAC follow from this: Blended, Paid, New-Customer, and Marginal. Each answers a different question and each hides a different problem.
The Fully-Loaded Numerator: Five Costs You Have to Add Back
Every honest CAC carries five expense buckets in the numerator. Miss one and you understate the cost of growth.
Direct media spend
The raw budgets across Meta, Google, and TikTok. In 2026, a standard DTC mix sits around 35 to 45 percent Meta, 30 to 40 percent Google, and 15 to 25 percent TikTok.
Meta CPMs run $10.88 to $14.91 with a median 2.2x ROAS, while TikTok runs cheaper at $4.00 to $9.16 CPMs but converts at roughly 1.4x ROAS. For deeper benchmark tables, see our paid social benchmarks.
Creative production
UGC sourcing, studio shoots, influencer seeding, copy, and design. This is the line item brands forget most often because it does not show up on the ad account invoice.
If you ship 20 ad concepts a month, the cost of those concepts belongs in the CAC numerator. Treating creative as overhead is how a $40 dashboard CPA becomes an $80 fully-loaded reality.
Agency and vendor fees
Retainers typically run 10 to 20 percent of managed ad spend. Mid-market performance agencies average $6,000 to $15,000 per month; premium specialists command $12,000 to $30,000+.
A brand spending $50,000 a month on ads is usually carrying a $5,000 to $10,000 retainer on top. That retainer belongs in the numerator on the channels it services.
Acquisition tooling (the SaaS stack)
The tracking, attribution, and lifecycle stack required to run the engine. None of it is optional once you cross $1M annual revenue.
| SaaS line item | Tier or trigger | 2026 monthly cost |
|---|---|---|
| Triple Whale (pixel-based attribution) | Under $1M GMV | $129 to $149 |
| Triple Whale | Scaling GMV | $300 to $500 |
| Northbeam (MTA + MMM) | Starter, under $250k/mo media | $1,000 to $1,500 |
| Northbeam | Pro / Enterprise | Custom, materially higher |
| Elevar (server-side tracking) | 1,000 orders/mo | $200 |
| Elevar | 10,000 orders/mo | $450 |
| Elevar | 50,000 orders/mo | $950 |
| Klaviyo (email/SMS) | 10,000 active profiles | $150 |
| Klaviyo | 50,000 active profiles | $720 |
| Klaviyo | 250,000 active profiles | ~$2,300 |
| Shopify Plus | Base floor (3-yr term) | $2,300 |
| Shopify Plus | Above ~$800k/mo GMV | 0.25 to 0.35 percent of GMV |
Elevar matters more than its line item suggests. Past 500 orders a month, server-side tracking recovers the 10 to 20 percent of conversion signal that iOS 14.5 stripped, and it feeds cleaner data back to the ad platforms. The CAPI mechanics live at server-side tracking.
Fractional internal headcount
Prorated growth lead, SDR, creative strategist, plus commissions and overhead. If your head of growth spends 70 percent of her week on acquisition, 70 percent of her loaded comp is a CAC input.
This is the line that closes the gap. A media buyer staring at a $40 dashboard CPA can be sitting on a $75 to $80 fully-loaded Paid CAC once retainer, production, tools, and payroll layer in.
How to split fixed costs across channels
To get a channel-level Paid CAC, fixed costs have to be fractioned. Two methods dominate.
Spend-weighted allocation. Fixed costs follow the raw ad budget. If Meta gets 70 percent of the spend and Google gets 30, a $10,000 agency retainer breaks $7,000 to Meta and $3,000 to Google. This is the default for most brands because it tracks where the work actually happens.
Revenue-weighted allocation. Fixed costs follow attributed revenue per channel. Better for cash-flow alignment but penalizes top-of-funnel channels that seed conversions further down the path.
The Four CAC Formulas (and What Each One Hides)
Treating CAC as one number is how good teams make bad scale decisions. Each formula answers a specific question; each lies in a specific way.
| CAC type | Precise formula | Best use | Primary blind spot |
|---|---|---|---|
| Blended | Fully-loaded S&M spend / Total new customers | Board reporting, halo effect | Organic subsidizes paid failure |
| Paid | (Paid spend + fractional fixed) / Attributed paid customers | Channel allocation | Platforms over-report their own conversions |
| New-Customer | Total acquisition spend / Net-new first-time buyers | Market penetration | Looks unviable without LTV context |
| Marginal | Δ spend / Δ customers | Finding the scale ceiling | Volatile in small samples |
Blended CAC (the boardroom metric)
Formula: Total Fully-Loaded S&M Spend / Total New Customers.
The right metric for investor decks and quarterly health checks because it captures the halo where paid awareness drives untracked organic conversions.
The lie: organic success masks paid failure. Imagine grading a math tutor by the average score of the entire class, including the straight-A kids she never met. Her real impact disappears in the average. Blended CAC does the same: a strong SEO presence or a viral organic moment can dilute and hide the fact that paid is incinerating cash. The blended-spend efficiency view that pairs with this lives at MER vs ROAS.
Paid CAC (the channel metric)
Formula: (Paid Spend + Fractional Fixed Costs) / Attributed Paid Customers.
The right metric for day-to-day budget allocation and channel-level optimization.
The lie: Paid CAC inherits whatever the ad platforms are willing to claim credit for. Meta and Google systematically over-attribute conversions to their own auctions, including conversions that would have happened from organic search or repeat intent. In 2026, true Paid CAC runs 2.4x to 3.1x higher than Blended. Triangulate the platform number against an independent attribution layer (Northbeam, Triple Whale, an in-house MMM). For the full attribution stack, see attribution stack.
New-Customer CAC (the growth metric)
Formula: Total Acquisition Spend / Net-New First-Time Buyers Only.
The right metric when you need to know what fresh market penetration actually costs. It strictly excludes any returning-customer revenue from the denominator.
The lie: in isolation it looks brutal. A $150 New-Customer CAC is fatal on a single-purchase product and a steal on a 12-month subscription. Read it only against retention and LTV. Subscription economics that move this number live at subscription LTV.
Marginal CAC (the scale frontier)
Formula: Δ Total Spend / Δ Total Customers.
The only formula that tells you what the next ad dollar costs, not what the last hundred averaged. Digital auctions get more expensive as you push into broader, less-qualified audiences, and Marginal CAC is the metric that surfaces that climb in real time.
The lie: it is volatile in small samples. You need weekly slope tracking with a denominator big enough not to swing on noise. Run it religiously anyway. The mechanics of pacing spend against the marginal curve live at scaling paid social.
Two Traps That Make Bad CAC Look Good
Both traps inflate the denominator. Both flatter the number. Both will tell you to spend more right before the model breaks.
The denominator trap: counting returning customers
A brand spends $10,000 in a month. They acquire 80 net-new customers and 120 returning customers come back to buy.
- Flawed math: $10,000 / 200 buyers = $50 CAC.
- Honest math: $10,000 / 80 net-new = $125 CAC.
The $75 delta is the difference between a thriving business and a bankrupt one. Repeat purchases are retention performance, not acquisition performance; they belong in MER, not CAC.
The timing-lag trap: November spend, December revenue
Judging fall's harvest against the seeds you bought during fall ignores everything you planted in spring. November's brand-building spend looks expensive measured against November conversions. December looks impossibly cheap because it is harvesting demand that November paid for.
The fix is cohort alignment: match acquisition spend to the cohort it actually influenced, not the cohort that happened to convert that month. The cohort math behind this lives at cohort analysis.
CAC Payback Period: the Formula That Decides If You Survive
CAC Payback Period (months) = Fully-Loaded CAC / Monthly CM2 per customer.
Under 3 months is excellent. 3 to 6 months is healthy. 12 months or more is a working-capital death trap, regardless of how strong the LTV:CAC ratio looks on paper.
LTV pays over years. Google bills today. That mismatch is why payback, not LTV:CAC, governs survival for any brand without unlimited capital.
The denominator: CM2, not revenue, not gross margin
Payback divides CAC by contribution margin (CM2), not by top-line revenue or standard gross margin. CM2 strips COGS plus pick/pack, shipping, returns, and payment processing fees.
Think of it as disposable income. Revenue is gross pay, gross margin is net pay after taxes, and CM2 is what is left after rent and utilities, the only money that can actually pay down the CAC card. The full CM1/CM2/CM3 derivation lives at contribution margin.
Why payback beats LTV:CAC for cash-constrained brands
Two public companies make the case more clearly than any framework can.
Casper went public with a 3:1 LTV:CAC on paper and a 15-month payback period because mattresses are infrequent purchases. Public markets punished them; they lacked the cash velocity to keep scaling without continuous venture funding.
Dollar Shave Club ran acquisition campaigns where CAC exceeded first-order margin, meaning they lost money on day one. But the subscription cadence kept payback tight, capital recycled fast, and they sold to Unilever for $1 billion.
The ratio tells you the destination. Payback tells you whether you survive the journey. The full ratio framework and when 3:1 is the right target live at LTV:CAC ratio; LTV itself lives at customer lifetime value.
Threshold ladder
- Under 3 months: Excellent. Rapid cash recycling, internal funding of scale.
- 3 to 6 months: Healthy for most DTC verticals if working capital is in place.
- 12 to 18+ months: Danger zone. High churn risk, capital-crunch risk, the "Trap" quadrant on every growth map.
The CAC Ceiling: How Cost Caps Your Spend
The Marginal Frontier is the exact moment your next ad dollar costs exactly the lifetime CM2 of the cohort it acquires. Spend one dollar past that point and you are buying revenue with negative contribution.
If your 60-day cohort yields $60 in CM2, your absolute CAC ceiling is $60. Healthy brands set their target CAC well below the ceiling, consuming no more than 25 to 40 percent of available gross profit. That headroom is what funds the next test, absorbs the next CPM hike, and survives the next ad-account hiccup.
The Brand A vs Brand B cash simulation
Two brands, identical unit economics. Both start with $50,000 in cash. Both have a $120 CAC and a $60 first-order margin. Both want to scale ad spend 20 percent month over month.
The only difference: Brand A's customers repurchase in month 2 (2-month payback). Brand B's customers repurchase in month 6 (6-month payback). Same LTV. Same CAC. Same target growth rate.
| Month | Brand A spend | Brand A cash | Brand B spend | Brand B cash |
|---|---|---|---|---|
| 1 | $10,000 | $45,000 | $10,000 | $45,000 |
| 2 | $12,000 | $44,000 | $12,000 | $39,000 |
| 3 | $14,400 | $42,800 | $14,400 | $31,800 |
| 4 | $17,280 | $41,360 | $17,280 | $23,160 |
| 5 | $20,736 | $39,632 | $20,736 | $12,792 |
| 6 | $24,883 | $37,558 | $24,883 | $5,350 |
| 7 | $29,860 | $35,070 | $29,860 | -$3,580 (bankrupt) |
| 8 | $35,832 | $32,084 | $35,832 | -$14,295 |
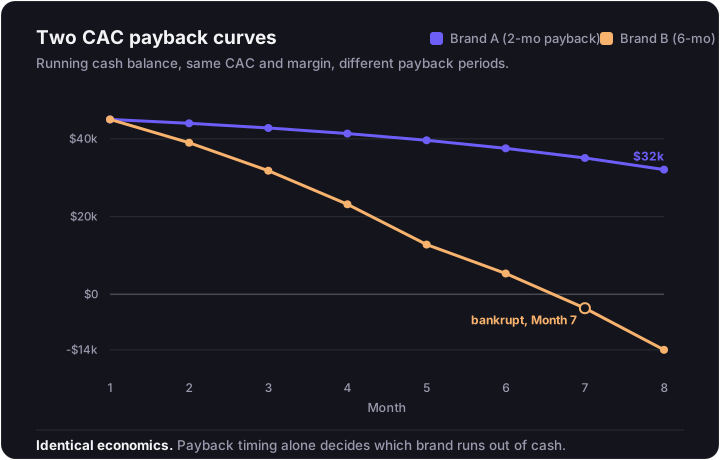
Brand A scales ad spend from $10,000 to $35,832 a month and never drops below $32,000 in the bank. Brand B is functionally insolvent in month 7. Identical economics, opposite fates, purely a cash-timing problem.
The lesson: payback period is not a footnote on the LTV:CAC ratio. It is the equation that decides whether the ratio ever gets to compound.
Native Deodorant: how a real brand set the ceiling
Moiz Ali bootstrapped Native by enforcing a strict internal CAC cap that guaranteed a 3x+ LTV:CAC from day one. The cap protected fragile working capital while the brand was small.
To raise the ceiling he did not bid harder. He engineered LTV up:
- A separate free-mini-deodorant SKU deployed purely as a referral incentive (over 100,000 successful referred customers).
- One-click cancel on Amazon subscriptions, which lifted cohort retention and pulled LTV forward.
Higher LTV produced a higher CAC ceiling, which let Native outbid competitors in the auction. The brand sold to P&G for a reported $100M. The pattern is reproducible: lift the ceiling on the back end, then spend into the room you just created.
How to Shorten Payback and Lift the Ceiling
Four levers, in descending order of leverage. Each one shortens the payback window, which raises the ad-spend ceiling.
Lift AOV on the first order
Setting a free-shipping threshold roughly 30 percent above current AOV reliably lifts AOV 15 to 25 percent without raising spend. Free-gift-with-purchase typically outperforms percentage discounts, because the discount erodes CM2 while the gift preserves it.
A higher first-order margin against a stable CAC mechanically shortens payback. This is the fastest lever most brands have.
Push customers into predictable replenishment
Subscriber LTV runs 50 to 70 percent higher than one-time-buyer LTV in the same window. Subscription DTC brands hit a benchmark 4.1:1 LTV:CAC versus 1.5:1 to 2.1:1 for one-time-purchase brands.
The full subscription math lives at subscription economics; the broader retention levers live at lift LTV.
Recover variable margin from logistics
Renegotiate 3PL rates. Switch to cheaper packaging. Tighten the return policy. Operators have captured 10 to 30 percent profit lifts through better unit-level management, and that lift drops straight into CM2.
Faster CM2 accumulation means faster payback without changing a single thing on the buy side. The margin mechanics live at contribution margin.
Recover lost conversion data
The 10 to 20 percent of conversion signal that iOS strips comes back through server-side tracking and CAPI. Better signal feeds smarter bidding, which lowers measured Paid CAC even when nothing changed on the creative or budget side. Implementation lives at server-side tracking.
The 90-Day Audit: What Your Real CAC Probably Is
Five steps. Do them this quarter, not next year.
- Rebuild the numerator. Ad spend + creative production + agency retainer + SaaS stack + fractional headcount.
- Filter the denominator. Net-new first-time buyers only. Strip returning customers out completely.
- Compute all four CAC formulas side by side. Blended, Paid (with fractional allocation across channels), New-Customer, and Marginal.
- Divide each by monthly CM2. That gives you the payback period in months.
- Plot the cohort cash curve. Run the Brand A / Brand B model against your actual starting cash and your actual growth rate.
Two patterns surface in almost every audit. Dashboard CPA is roughly half of fully-loaded Paid CAC. And the "comfortable" LTV:CAC ratio quietly hides a 9-month payback that the brand cannot finance.
Where This Leaves You
Two paths, depending on what the audit turns up.
If your dashboard CPA is hiding a fully-loaded CAC nearly double that number, start with a paid media audit. We rebuild the numerator, filter the denominator, and surface the four CACs and the payback period against your actual cash position.
If you already know the math is wrong and you need the creative and measurement engine to fix it, see performance marketing services. The work is the same in either order: get the number right, then build a media system that scales inside the ceiling instead of through it.