Incrementality Testing: Did Your Ads Cause the Sale?
Incrementality testing is the only measurement method that answers whether your ads actually caused the sale, or whether the customer was always going to buy. Everything else, including the platform ROAS your media buyer reads every morning, is correlation dressed up as causation. In 2026 the gap between the two is wide enough to bankrupt a scaling plan.
What incrementality testing actually answers
Would this customer have purchased if they had never seen the ad? Platform ROAS cannot answer that. A controlled experiment can.
The output metric is iROAS, incremental return on ad spend, calculated as the revenue your ads genuinely caused divided by the spend that caused it. Across 225 geo-based DTC tests Stella published in 2025, median iROAS landed at 2.31x. The same accounts were reading much higher ROAS numbers in their ad managers. Incrementality sits next to your daily attribution stack, not inside it. Blended MER is the daily proxy. Incrementality is the periodic truth check that calibrates both.
The ROAS lie: how much of your "attributed" revenue is non-incremental
A well-run incrementality test on a mid-size DTC business typically finds that 25 to 40 percent of platform-attributed conversions are entirely non-incremental. The brand is paying for sales that would have happened anyway.
The most-cited single example: a Meta account reported 25 percent of total orders coming from its ads. A causal test revealed only 12 percent were incremental. Meta was overstating its contribution by 108 percent. The Stella 225-test benchmark shows the same pattern at channel level. Branded search clocked a 0.70x iROAS, meaning the ads were cannibalistic, intercepting demand that already existed. Discovery channels did the opposite. Connected TV led the pack at 3.30x, with Google Performance Max at 2.98x, Pinterest at 2.96x, and Meta at 2.92x. A 2024 TransUnion study found 52 percent of TikTok-led incremental conversions were exclusive to TikTok, demand the platform was actually creating rather than intercepting.
The pattern is consistent enough to plan around.
| Channel type | Median iROAS (Stella, n=225) | What platform reporting tends to do |
|---|---|---|
| Connected TV | 3.30x | Under-credit (delayed, cross-device) |
| Google Performance Max | 2.98x | Roughly accurate at the channel level |
| 2.96x | Under-credit on view-through | |
| Meta (prospecting) | 2.92x | Mixed; retargeting layers inflate the number |
| TikTok | High (52% exclusive lift, TransUnion) | Heavily under-credit in last-click |
| Retargeting (programmatic) | Often <1.0x in isolation | Heavily over-credit (intercept) |
| Branded Google Search | 0.70x | Cannibalistic; takes credit for organic intent |
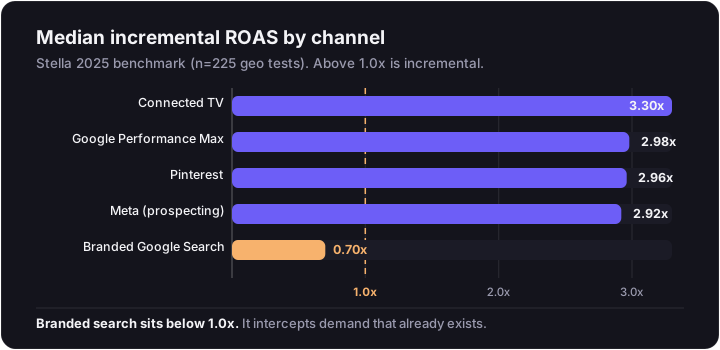
If your reported ROAS contradicts your bank deposits, the gap is here. This is the wedge into both the blended truth question and the diagnostic in stalled scaling.
When to run an incrementality test (and when not to)
Run one when:
- You are about to make a quarterly budget reallocation across channels.
- A channel's reported ROAS contradicts your MER movement (platform says efficient, blended is sliding).
- Retargeting spend is climbing without a corresponding lift in MER.
- You are deciding whether to add a new top-of-funnel channel and need a defensible read after 60 days.
- Your branded search line item has grown faster than your branded search demand.
Do not run one when monthly conversion volume is too thin. The standard deviation of weekly sales will swallow the lift signal and you will spend $20k to learn nothing. As a rough floor: if you cannot generate 50 to 100 conversions per week in the test cell, a user-level lift study will not reach significance, and a geo test needs enough baseline volume per DMA that a 10 to 20 percent lift is visible above local noise. Both belong in the cadence of a quarterly paid media audit rather than as a one-off panic move.
The four causal methods at a glance
Four methods own the practical landscape. Each answers a different question.
| Method | What it proves | Min spend | Duration | Primary blindspot | Best use case |
|---|---|---|---|---|---|
| Geo holdout test | Channel-level causal revenue impact, independent of platform tracking | $15k - $30k | 2 - 8 weeks (4 - 8 recommended) | Geographic bleed, opportunity cost, local noise | Proving total Meta or TikTok actually moves Shopify deposits |
| Platform conversion lift (CLS) | Causal lift of a specific campaign, creative, or audience inside one platform | $30k - $120k | 2 - 4 weeks | Platform grades its own homework; pixel/EMQ dependent | Validating a creative concept or audience inside Meta or TikTok |
| Ghost ads / ghost bids | True incremental value of programmatic retargeting without media waste | $30k - $50k | 21 - 35 days (after 2 - 3 mo warm-up) | Confined to RTB; not Meta or Google walled gardens | Cleaning up retargeting attribution |
| Post-purchase survey (HDYHAU) | Perception of influence; captures dark social (podcasts, PR, WOM) | $0 | Continuous | Human memory; over-credits "spark" channels | Finding channels pixels cannot see |
The four sections that follow walk each one.
Method 1: Geo holdout tests (matched-market)
Geo holdouts are the gold standard of independent measurement because they use your own backend revenue, not a platform pixel. Apple's App Tracking Transparency, cookie deprecation, and ad-block extensions are irrelevant to the read. Shopify either deposited more money or it did not.
The five-step build:
- Pick treatment and control DMAs using Synthetic Control Methods. Instead of comparing Austin to Nashville on gut, a model algorithmically weights 10 to 20 candidate control geographies into a statistical twin that matches the treatment region's pre-period sales trend.
- Run a pre-period (typically 4 weeks) to lock the synthetic weights against real history.
- Apply the intervention. Either cut spend in the treatment cell to zero or double it. Both work; zeroing is the cleaner read.
- Hold for 4 to 8 weeks. Two weeks is the published floor but it rarely smooths out payday cycles, weather, and local promo noise.
- Read the gap between actual treatment-region revenue and the synthetic forecast. The difference is incremental revenue.
The plain caveats: geographic bleed (a Newark resident commuting to Manhattan still sees the "paused" ads on the train), opportunity cost (you are intentionally giving up revenue in the control markets for the duration), and local noise (one unseasonable storm in a control DMA can warp the synthetic baseline). Budget band per the published benchmarks: $15k to $30k of dedicated treatment-cell spend for a statistically clean signal on a mid-market account.
Tools that run geo holdouts
| Tool | Price band | Scope | Best fit | Anti-fit |
|---|---|---|---|---|
| Haus | Custom enterprise, historically cited starting around $15k/month | Standalone experimentation, automated geo lift, MMM informed by tests | Heavily scaled DTC needing dedicated experimentation tooling | Small brands wanting an all-in-one attribution dashboard |
| Stella | $500/mo (Starter), $3,000/mo (Pro), up to $10,000/mo (managed) | Self-serve growth intelligence native to Shopify and WooCommerce; automates holdouts | Mid-market DTC ($5M+) wanting enterprise-grade measurement without enterprise complexity | Multinationals with complex offline wholesale stacks |
| Measured | Enterprise, ~$50,000/year and up | Cross-channel A/B and geo tests powering a test-calibrated MMM, 300+ integrations | Mature multi-channel brands needing CFO-grade defensibility | Scrappy teams under $100k/mo wanting daily campaign agility |
| Recast (GeoLift) | $100/mo entry, $3k - $5k/mo typical, $35k - $75k+/year enterprise | Bayesian MMM (40,000+ parameters re-estimated weekly) calibrated by GeoLift tests | Omnichannel brands where last-click has collapsed | Micro-brands on a single channel |
| Paramark | $150,000 - $220,000+/year | Synthetic-control geo testing plus 1 - 3 MMM models with a dedicated human Growth Advisor | Enterprise or funded growth-stage brands wanting white-glove advisory | Self-serve brands who just want software |
Method 2: Platform conversion lift studies (Meta and TikTok)
A platform Conversion Lift Study (CLS) is a randomized controlled trial conducted inside one walled garden. The platform uses its own identity graph to split your target audience into a test cell that sees ads and a holdout cell that is suppressed. The conversion-rate delta between the two is the lift.
The output is granular in a way geo cannot match: cost per incremental conversion and iROAS for a specific campaign, a specific creative concept, or a specific audience segment.
Practical minimums:
- Meta CLS requires a $5,000 account-spend history in the past year and at least 500 logged optimized conversions on the pixel. The real floor for statistical confidence is 50 to 100 conversions per week per test cell, which puts most useful tests at $30k to $120k over 2 to 4 weeks.
- TikTok CLS requires heavy TOF investment. Premium placements like TopView carry a $50,000 minimum spend on their own.
The blindspots are real. The platform is grading its own homework, so low Event Match Quality silently poisons the result before you read it. Conversions that fall outside the standard attribution window (the user purchases 45 days later) are excluded entirely. And holding out 10 to 20 percent of a highly qualified audience genuinely costs immediate revenue for the duration of the test. CLS validates specific creative and audience decisions inside your account structure; it does not validate the channel as a whole.
Method 3: Ghost ads and ghost bids
Geo and CLS both force you to give up sales. Ghost ads do not. They are a programmatic-only method that exploits how Real-Time Bidding actually works.
Think of a ghost bid like a silent auction bidder who bids high enough to win, then steps aside at the last millisecond and lets the next bidder take the item so they can watch what happens. The DSP still calculates and theoretically "wins" the auction for the control cell, then withholds the ad at the final moment, logs a ghost impression, and lets the next advertiser serve. The brand never pays for the impression and never deprives a qualified user of a relevant ad they would have seen from somebody else anyway. Opportunity cost effectively disappears.
What the method exposes is the part of the funnel that MTA over-credits most aggressively: retargeting. Remerge's published case is the clean illustration. The brand's standard multi-touch model gave the retargeting platform 50 percent credit for multi-touch conversions. A 28-day ghost-bid test on the same campaign revealed that of 1,000 platform-attributed conversions, only 500 were incremental. The platform was being over-credited by exactly 50 percent.
Ghost ads can also vindicate retargeting that genuinely works. RTB House's seminal study showed a true causal retargeting campaign lifting visits 17.2 percent and purchases 10.5 percent. The point of the method is not to indict retargeting on principle, it is to separate the campaigns that lift from the ones that intercept.
Caveats: ghost ads only work in environments where the auction is visible and manipulable, which excludes Meta and Google Search entirely. They require $30k to $50k of programmatic spend over 21 to 35 days, and the DSP needs 2 to 3 months of warm-up before the test cell is stable.
Tools that run ghost-bid tests
- RTB House. Deep-learning DSP that bakes ghost ads into its retargeting and acquisition algorithms. Built for e-commerce and travel brands with serious site traffic; struggles on niche brands without enough user data points to train against.
- Remerge. Ghost-bid mechanics adapted for mobile retargeting and continuous uplift reporting. The right call for app-first businesses; the wrong one for pure desktop e-commerce.
- SegmentStream. Conversion modelling platform with an explicit geo incrementality module and AI-driven budget reallocation. Built for teams spending $100k+/month who want the software to act on the read, not just report it.
Method 4: Post-purchase surveys (HDYHAU)
The qualitative leg of the stool. A "how did you hear about us" question fires on the order confirmation screen the moment a purchase completes. Done right, the mechanics are:
- Randomize the order of answer choices on every load to kill response bias.
- Use conditional logic. If the user picks "Podcast," ask which show. If "Creator," ask which handle. If "ChatGPT" or another LLM, ask what query.
- Pipe responses via webhook into your BI tool, tied to the exact order ID, customer LTV, and first product purchased.
What this proves is the perception of influence, which sounds soft until you realise it is the only thing that catches dark social. A user hears a brand mentioned on a podcast, talks about it in a WhatsApp group, opens a fresh tab, searches the brand name, and clicks the paid result. Last-click gives 100 percent of the credit to Google paid search. The survey correctly identifies the podcast.
Aggregate surveys consistently show channels like PR, influencers, podcasts, and TV driving up to 70 percent of brand discovery despite barely registering in platform dashboards. Completion rates land between 45 and 85 percent when the survey is native to the post-checkout flow. Map survey responses against LTV and you find which specific creators bring in repeat buyers rather than one-off conversions.
The caveats are honest. Surveys rely on human memory, which over-credits memorable "spark" channels (a TikTok creator, a podcast) and under-credits passive view-through display, even when the display did the priming work. Treat the data as directional, not as a mathematical constant.
Survey tools
| Tool | Pricing | Best fit | Anti-fit |
|---|---|---|---|
| Fairing | Free under 100 orders/mo, $49/mo to 1,000 orders, $149/mo to 5,000 orders | Standard Shopify merchants who want HDYHAU live in minutes with 25+ deep integrations | Brands needing massive multi-page logic trees or running off-Shopify |
| KnoCommerce | $19 (Starter), $119 (Analyst), $299 (Pro), $499 (Enterprise) | Data-heavy brands running CRO experiments with different questions for new vs returning customers | Early-stage stores wanting a one-question flat-rate tool |
| Grapevine | $25/mo flat, unlimited responses | Stores doing 200+ orders/mo who want predictable cost regardless of volume | Micro-stores under 100 orders where competitors offer free tiers |
How to actually run a geo holdout in week one
Skip the theory. The practical build:
- Pick the channel in question. Usually Meta or TikTok, since that is where the platform-vs-bank gap shows up first.
- Choose 6 to 10 candidate DMAs roughly matched on baseline weekly sales and seasonality. You want a mix you can split into treatment and control with enough volume for the synthetic to settle.
- Run a 4-week pre-period at normal spend. This locks the synthetic control weights against real history. Skip this and you are guessing.
- Apply the intervention. Cut treatment-cell spend on the test channel to zero (cleanest), or double it (faster lift signal, less clean).
- Hold for 4 to 8 weeks. Anything shorter and weekend cycles, weather, and one local promo can dominate the read.
- Pull the read against Shopify revenue in the treatment region, compared to the synthetic forecast. Do not read it against platform-reported numbers, which is the whole reason you are running the test.
Conversion-volume floor: if your treatment cell does not generate enough weekly orders that a 10 to 20 percent lift would be visible above weekly variance, the test will come back noisy regardless of methodology. The signal is buried, not absent. A noisy read looks like wide confidence intervals, a near-zero point estimate with a huge standard error, or a result that flips sign week over week.
The output of the test feeds scaling decisions directly and lives inside the metric stack as the periodic truth layer.
Reading the result: turning iROAS into a budget decision
A test result is useless until it changes how you bid. The translation is the Incrementality Factor.
If a geo holdout proves Meta is 60 percent incremental, the IF is 0.60. The algorithm cannot find the incremental buyer on its own because the platform is optimizing toward all attributed conversions, including the 40 percent who would have purchased anyway. You have to handicap the target so the optimizer works harder.
For a tCPA campaign: multiply your true allowable CPA by the IF.
- Allowable CPA: $50
- IF: 0.60
- New platform tCPA: $50 × 0.60 = $30
For a tROAS campaign: divide your break-even ROAS by the IF.
- Break-even ROAS: 3.0x
- IF: 0.60
- New platform tROAS: 3.0 / 0.60 = 5.0x
Advanced setups push this further with Reverse ETL, sending incremental-only conversion values back into the platform API so the algorithm optimizes against the causal value instead of the gross one. Either way, the principle is identical. The algorithm will optimize toward whatever target you set; set the target as if 40 percent of its claimed wins do not exist, and it will hunt the 60 percent that do. This is where the result connects to scaling and to your break-even economics.
Triangulation: why one method is never enough
No single method is the truth. The cadence is:
- Daily. Media buyers pace against platform MTA and pixel ROAS, treated explicitly as correlative signals for tactical decisions, not strategic ones.
- Weekly. Analysts read HDYHAU survey distributions for dark-social gaps. If TikTok is driving 18 percent of "how did you hear about us" responses but its pixel only attributes 4 percent of orders, that gap is the brief for the next test.
- Quarterly. Run a geo holdout or platform CLS on the highest-spend channels to refresh the Incrementality Factor. Recalibrate platform targets accordingly.
- Always. Blended MER stays the daily north star. Reported ROAS gets read through the most recent IF. Survey data flags where to point the next causal test.
That loop, run consistently, is the realistic version of "knowing what works." It belongs inside the attribution stack alongside MER as the daily reference.
Common mistakes brands make on their first test
- Running it on a channel without the conversion volume to clear noise.
- Skipping the pre-period and picking control DMAs by gut.
- Reading the result on platform-reported revenue instead of Shopify revenue (the entire point of the geo method is to avoid this).
- Treating one quarter's IF as a permanent constant instead of recalibrating.
- Running the test during a promo window, a PR spike, or a launch.
- Confusing a CLS (granular, within-platform) with a geo holdout (channel-level, independent) and using the wrong one for the question.
- Holding out a control on a $20k/month channel and expecting a clean read. The math will not be there.
Where this fits in the rest of the measurement stack
Incrementality is the truth layer. It does not replace daily attribution or blended ROAS, it calibrates them. The right next read depends on which gap you actually have. If platform attribution itself is the murky part, the attribution stack is the right read. If reported ROAS keeps drifting from your blended number, the framing lives in MER vs ROAS. If your platform CLS results look wrong because the pixel match is weak, the fix is upstream in server-side tracking. The broader metric stack is where all of this gets logged.
Run your first incrementality test on the right channel
Most brands do not need all four methods on day one. They need to pick the single channel where the platform number and the bank deposits disagree the most, and test it. Branded search and retargeting are the usual suspects. Whichever line you suspect of intercepting demand rather than creating it is the first cell.
The productized version of that diagnosis is a paid media audit. It maps the gap between reported and blended numbers, identifies the channel most worth a quarterly geo holdout, and writes the test plan. Teams who want the measurement loop built into an ongoing engagement should start with our paid media service or the creative and media engagement instead.
Either way, the first test is the one that stops the bleed.
You
Can you look at our ads?
Want this read on your own ads?
We pull your live ads from the Meta Ad Library, set them next to the longest-running ads in your category, and send back what we'd change and test next. The teardown is free.
Get my free creative teardownWe usually reply within one business day.