
The LTV:CAC ratio you keep hearing about, the famous 3:1, was born inside a 2010 Matrix Partners deck about mature public SaaS companies. It has since been quietly scaling direct-to-consumer brands straight into bankruptcy, because applying a Salesforce-shaped rule to a brand that ships physical product on 50% gross margins is a category error.
The actual job of this ratio is not to grade your business at a board meeting. It is the mathematical ceiling on what you can pay for a customer, and the speed at which you can spend more without running out of cash.
Read this page if you want a clean answer on what "healthy" looks like for your category, why the SaaS number misleads you, and how the ratio quietly governs your daily ad-spend decisions. Math for the components lives on neighboring pages.
The short answer: what a healthy LTV:CAC ratio looks like in DTC
Use 60- to 90-day contribution-margin LTV against fully loaded CAC. Healthy is 1.5:1 for high-ticket durables, 2.5:1 to 4:1 for apparel and food, 3:1 to 6:1 for supplements and skincare, and up to 10:1 for utility subscriptions. The 3:1 SaaS rule is not a target.
Three numbers most brands actually need: a floor of 1.5:1 at scale, a normal working band of 2.5:1 to 4:1, and a cash-flow gate of 60- to 90-day payback. Miss the gate and the ratio cannot save you.
The math behind those inputs sits on the deeper LTV page and the fully loaded CAC page. This page owns the ratio and what it forces you to do.
Why the 3:1 rule is a SaaS lie for DTC
The 3:1 benchmark was popularized around 2010 by David Skok at Matrix Partners, drawn from observations of mature, publicly traded SaaS companies like Salesforce and HubSpot at steady state. For B2B software, it is a fine proxy. Median B2B SaaS today still sits comfortably at 3.2:1, with top-quartile companies at 4:1 to 6:1.
SaaS earns that 3:1 with three structural gifts: 80% to 90% gross margins, contractual recurring revenue, and predictable multi-year customer horizons. None of those are true for a brand that ships boxes.
DTC gross margins generally land between 40% and 60%. Apply 3:1 to top-line revenue at 50% gross margin and the real margin-based ratio is 1.5:1. Skok's heuristic, transplanted unchanged into retail, is what one analyst frames as a 15-year drift: a steady-state software rule misapplied to pre-steady-state physical-goods companies.
This is why we route the underlying contribution margin mechanics out to its own page. The minute you mix revenue LTV with a SaaS-shaped expectation, your model is already lying to you.
The three structural reasons SaaS economics do not transfer
1. The gross margin chasm
SaaS replicates code at near-zero marginal cost. DTC pays for raw materials, packaging, 3PL pick-and-pack, outbound shipping, payment processing, and returns on every single order.
Finaloop puts it bluntly: the gap between revenue and gross margin is rounding error in SaaS and the entire game in e-commerce. A clean working analogy is that revenue is your gross paycheck, gross margin is your net pay after tax, and contribution margin is what is actually left after the commute and lunch you cannot opt out of.
2. Contractual vs. non-contractual retention
SaaS churn is contractual. The customer pays until they cancel, which makes month-12 paid retention in software bottom out around 71%.
DTC retention is non-contractual. Customers buy again when they feel like it, and repeat-purchase rates frequently collapse to roughly 28% by month 12. Long-horizon LTV is forecastable in software and structurally noisier in retail, which is why the ratio needs a shorter, harder timeframe to be honest. Deeper retention work belongs on cohort curves and subscription economics.
3. Payback period sensitivity
A SaaS company with strong venture backing can tolerate 12 to 18 months of CAC payback because the revenue is contracted and the cap table is funded. A DTC brand pays cash for inventory and cannot wait 14 months to recoup marketing spend without suffocating.
The punchline most brands have not internalized: a 2:1 ratio with a 60-day payback beats a 4:1 ratio with an 18-month payback for any brand running on its own cash. Capital velocity is the variable the 3:1 rule is structurally silent on.
What the ratio is actually measuring (one definition, no math)
The ratio is the total contribution-margin profit a customer returns over a defined window, divided by the fully loaded cost to acquire them. Both inputs are doing real work, and both are routinely faked.
- LTV here means margin-adjusted, not revenue. The deep calc and the cohort work live on customer lifetime value.
- CAC here means fully loaded, including agency retainers, software, creative production, and seeding, not the platform-reported CPA in Ads Manager. The deep calc lives on customer acquisition cost.
This page does not rederive either input. It owns the ratio itself and the decisions the ratio forces.
The reason that distinction matters: a brand that calculates LTV from revenue and CAC from platform reports overstates its true health by roughly 30%. That is the single most common way DTC founders convince themselves they have a 3:1 business while the bank account quietly bleeds.
Healthy LTV:CAC ranges by DTC category
There is no universal target. The right ratio is dictated by your gross margin and your purchase frequency, not by what the deck said. A luxury furniture brand and a subscription coffee company are not playing the same game, and a single benchmark for both is malpractice.
| DTC category | Typical gross margin | Healthy margin-adjusted LTV:CAC | Economic driver |
|---|---|---|---|
| High-ticket durables (mattresses, furniture) | 40-55% | 1.5:1 to 3:1 | Infrequent, one-shot, profit on order one |
| Fashion and apparel | 50-60% | 2.5:1 to 4:1 | Seasonal repeat, returns drag |
| Food and beverage | 35-50% | 2:1 to 4:1 | Low CAC, brutal margins, habitual replenishment |
| Health and supplements | 60-70%+ | 3:1 to 6:1 | High margin and daily-use repurchase |
| Consumables (skincare, coffee) | 50-65% | 4:1 to 7:1 | Compounding cohort retention |
| Subscription DTC | 45-60% | 4.1:1 to 10:1 | Contractual or near-contractual cadence |
The why behind each band:
- Durables are functionally first-order profitable. A customer is not buying another mattress for a decade, so the LTV approximates the AOV, and a 1.5:1 ratio with a fat first-order margin is a viable business.
- Apparel sits on roughly a $66 average CAC against 50-60% margins, with returns near 14% eroding contribution margin further. The brand usually breaks even on the second order and earns its profit on the third.
- Food and beverage has one of the lowest average CACs in DTC at around $53, but heavy shipping weight and perishability suppress contribution margin. Survival is built on monthly repurchase, not first-order economics.
- Supplements ride a 37.7% 24-month repurchase rate, which funds a higher allowable CAC. Day-one losses are expected; the third and fourth orders are where the model earns out.
- Consumables like skincare and coffee compound on cohort retention. A consumable brand sitting under 4:1 is usually under-investing in acquisition, not over-spending.
- Subscription is structurally predictable. Subscriber LTV typically runs 50% to 70% higher than one-time-buyer LTV, which is why utility refills with churn under 5% can push 10:1.
Two callouts worth pinning to a whiteboard. Below 1.5:1 at scale is structural failure, not a marketing problem you can creative your way out of. The brand is not generating enough margin per customer to fund the overhead required to operate.
Above 5:1 outside of subscription utilities usually means you are under-spending and leaking share to competitors who can afford to outbid you. That is when the right move is to push harder, not to congratulate yourself. The scaling playbook picks up there.
The ratio without payback is a ghost story
LTV:CAC tells you the destination. Payback tells you whether you survive the journey.
The most common DTC scale-up death, per TopGrowth Marketing's data, is a brand looking at a 3:1 ratio on a 12-month horizon while the same business is actually 1.2:1 on a 60-day basis. They scale aggressively against the 12-month projection and suffocate inside 90 days because the latent margin they were counting on has not yet landed in the bank.
The public-market case is right there in the receipts. Casper went public on roughly a 3:1 blended ratio with a 15-month payback because mattresses are infrequent purchases, and the market punished the lack of cash velocity. Dollar Shave Club spent above first-order margin on day one, kept payback tight via subscription cadence, and sold to Unilever for $1 billion.
A clean way to think about where you sit:
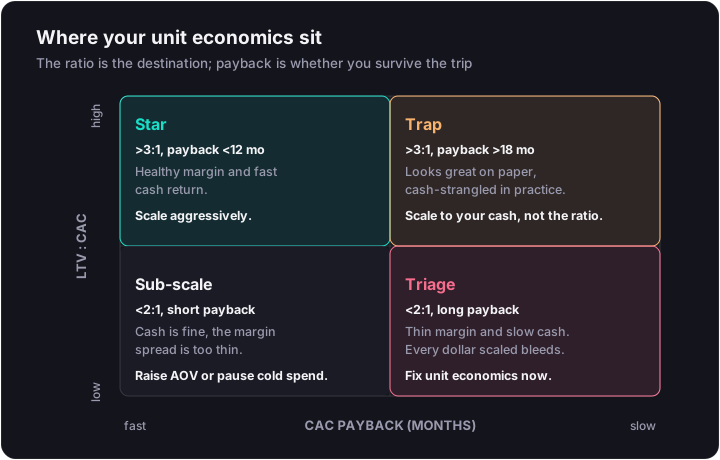
Taylor Holiday at Common Thread Collective frames the spend side as "fuel profit." Your allowable CAC is gross profit per unit minus the net profit you need to keep the lights on. If a product yields $60 of gross profit per unit and the business requires $15 of net per unit, the absolute CAC ceiling is $45. The ratio is the score; fuel profit is the line you cannot cross.
How the ratio caps your ad spend (the part nobody tells founders)
The ratio is not a report card you review quarterly. It is the governor on how fast you can scale week over week.
As you push spend up, CAC inflates structurally. You exhaust the warmest, highest-intent audiences first, then push into progressively colder cohorts that need more impressions and steeper discounts (15% to 30% off sitewide on first order is typical) to convert.
A 3.5:1 brand can absorb a 20% CAC inflation during a scaling push and stay solvent. A 2:1 brand goes underwater on the same push. A higher LTV is not just a retention story; it is an offensive weapon, because it mathematically lets you outbid competitors in the ad auction.
This is exactly the dynamic the Brand A vs. Brand B cash-flow simulation in the source research isolates: two companies with identical unit economics, one with a 2-month payback and one with 6 months, growing spend 20% month over month. The 2-month brand scales internally indefinitely. The 6-month brand is functionally bankrupt by month seven despite identical headline economics. The full month-by-month walkthrough belongs in the scaling deep dive.
The blended-truth metric that surfaces this in daily decisions is on MER vs ROAS. Platform ROAS alone will hide it until the cash runs out.
Stop using platform CPA and revenue LTV (the measurement layer)
Most ratios are wrong before they are calculated. Two specific lies, fixable today.
- Platform CPA understates true CAC. Ads Manager omits agency retainers (typically $10k to $50k or 10-20% of spend), attribution software (Triple Whale runs $129/month up to $4,489+/year by GMV; Northbeam runs $1k to $2,500+/month), and creative production ($3k to $8k per high-production video). Real CAC sits meaningfully higher than the platform number.
- Revenue LTV overstates true value. It ignores COGS, 3PL fees, outbound shipping, payment processing, returns, and discounts. Fulfillment alone eats 25 to 30 percentage points of gross margin for a median DTC brand.
- The fix is one architecture. Server-side transaction data via CAPI feeding a centralized analytics layer (Triple Whale, Northbeam, or Lifetimely) so contribution-margin LTV:CAC updates daily, not quarterly. The implementation lives on server-side tracking.
- The blended-truth metric for daily decisions sits elsewhere too. MER vs ROAS is the day-to-day dashboard; the full attribution stack lives on attribution.
What to do when your ratio is broken (triage)
If your 60-day contribution-margin LTV:CAC is sitting at 0.8:1, scaling spend is the wrong move. Five ordered fixes, in order of speed-to-impact:
- Raise AOV before you raise spend. Ridge Wallet hit a CPC floor and could not lower acquisition cost further, so they launched a $600 premium travel kit alongside their $150 wallets. Quadrupling AOV on specific tracks mathematically let them tolerate 4x CAC on those funnels.
- Kill sitewide discounts, replace with structured offers. Flux Footwear swapped traditional 30% sitewide codes for a 40% post-purchase cashback. AOV climbed to $174, but because not every customer redeemed the cashback, the effective discount to the brand was only 13.5%.
- Trim marketing overhead. A $15k monthly agency retainer that is not visibly compounding the ratio belongs reallocated into media or in-house creative. Fully loaded CAC includes that retainer whether you like it or not.
- Compound owned and organic. SEO acquisition can land near $31 per lead and CAC on that channel drops 40-50% by month 12 as content compounds. See paid vs organic for where the split actually pays.
- Pause top-of-funnel until contribution margin is restructured. Below a 1:1 ratio, cold-audience spend is accelerating the bleed. Restrict spend to high-intent retargeting and retention while you fix pricing, packaging, or 3PL rates.
If the inputs look right and the ratio still feels broken, the diagnostic page is why ads stopped scaling.
The ratio's job in 2026: financial gatekeeper, not vanity score
Post-ZIRP DTC has discarded revenue-based 3:1 as the operating standard. The ratio that survives this market is fully burdened, contribution-margin, time-boxed to 60 to 90 days.
Held that way, it stops being a number on a quarterly slide and becomes a daily gate. How much you can bid in the auction this afternoon, which creative cohorts you can afford to keep funding, when to push and when to hold: all of it is downstream of where the ratio actually sits today.
The ratio is the score. The CAC and LTV pages are where you move the inputs. And creative is the lever that actually moves CAC once media buying is mostly algorithmic.
Where to go next
- If your numbers feel off, start with the diagnostic on a paid media audit.
- If the ratio is healthy and you want to push, the scaling playbook is the next read.
- If the ratio is broken because creative has plateaued, performance creative is the conversion bridge.