
Most paid social benchmarks DTC brands get handed are useless. A single global average tells you nothing about whether your $42 CPA on supplements is a disaster or a steal, and a leaderboard of "top brand" numbers makes you panic over the wrong things. This page is the diagnostic chart, not the scoreboard: ranges by category and AOV, with the context that decides whether your numbers are healthy or quietly killing the business.
Are Your Paid Social Numbers Healthy? The 2026 Cheat Sheet
Here is the fast read on 2026 DTC paid social. Meta CPMs run $18 to $45 against a $13 to $18 median. TikTok sits at $4 to $13. Meta CTR is 1.5% to 2.8%; TikTok 0.5% to 1.5%. Hook rate baseline is 25% to 30% on Meta, 30% to 35% on TikTok. Platform ROAS averages 1.86x to 2.19x on Meta and 1.41x on TikTok. The only number that actually decides if you are profitable is blended MER, with a healthy band of 2.5x to 4.0x.
Read this like a clinical workup. Any single number out of context is medical malpractice. A 2% CVR is a triumph for a $300 sofa and a disaster for a $25 snack. Hold these tiers next to your own category and AOV before you fire anyone.
How to Read These Benchmarks Before You Panic
Three rules before you compare a single number.
Ranges, not averages. The spread between the best and worst account in the same vertical is routinely 2x to 3x. A "median" Meta CPM hides accounts paying $14 and accounts paying $45 for the same product.
Read against your AOV and category. Price point shapes conversion more violently than category. Mobile vs desktop changes it again. Treat the global mean as a smell test, not a target.
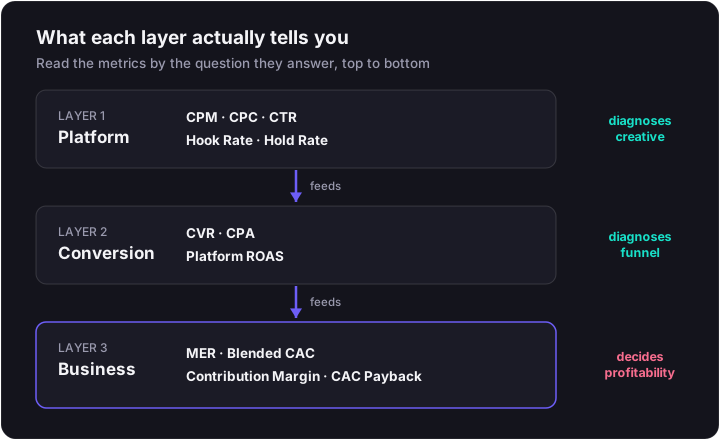
Platform metrics diagnose the creative; business metrics decide profitability. Hook rate, CTR, and CPM tell you whether the ad is working. MER and contribution margin tell you whether the company is. Do not confuse the two.
One more thing before you read the dashboard numbers below: every platform-reported figure here is overstated. Ad platforms over-credit themselves by 15% to 40% through view-through attribution and multi-channel signal loss, which is why Meta and Google can both claim 100% of the same sale. Hold that caveat in your head every time you see "platform ROAS" or "platform CPA." For the mechanics, see our metric stack breakdown, the attribution deep dive, and the platform ROAS vs MER split.
CPM Benchmarks: Meta vs TikTok 2026
Meta CPMs sit in an $18 to $45 band for most DTC advertisers, with an ecommerce-specific average around $17.88 and a cross-industry median of $13.48. TikTok runs cheaper and flatter, planning at $4 to $13 with medians ranging from $4.80 (Lebesgue) to $8.30 (Wordstream) to $13.26 (Triple Whale's heavily-DTC panel). If your dashboard disagrees with one source, that is why.
Q4 breaks the band. Meta apparel CPMs routinely run $50 to $70 in the holiday stretch, and Black Friday week alone doubles or triples baseline. TikTok CPMs spike 30% to 65% over Q4, sitting 45% to 50% above baseline by November and pushing competitive ecom into the $15 to $20 range.
There is one external factor worth naming because it warps the auction more than anything else: Temu and Shein. Temu alone spent an estimated $3 billion on ads in both 2023 and 2024, becoming Meta's single largest advertiser. When tariff threats cut its US digital spend by 51% in early 2026, CPCs for everyone else plunged, then spiked up to 40% within days when Temu ramped back. If your CPM moved 20% week-over-week and your account did not, look outside.
| Category | Meta CPM (typical) | Meta Q4 spike | TikTok CPM (typical) | TikTok Q4 |
|---|---|---|---|---|
| Beauty / Health | $12 to $25 | $35 to $50 | $5 to $9 | +30 to 65% |
| Apparel / Fashion | $18 to $35 | $50 to $70 | $5 to $9 | +30 to 65% |
| Food & Beverage | $14 to $22 | $25 to $35 | $6.33 (median) | +30 to 65% |
| Electronics / Hardware | ~$7 to $15 | $20 to $30 | $4 to $7 | +30 to 65% |
| Home Goods / Furniture | $15 to $30 | $30 to $45 | $4 to $8 | +30 to 65% |
| Sports & Outdoors | $12 to $20 | $25 to $35 | $3.79 (median) | +30 to 65% |
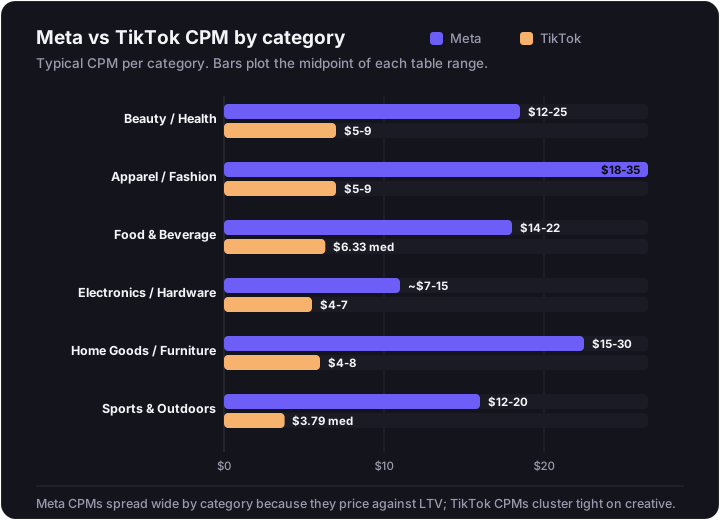
The pattern: Meta CPMs spread wide by category because they price against customer LTV; TikTok CPMs cluster tightly because creative quality drives the cost, not the vertical.
Why your CPM is at the top of the range
If you are paying $40+ Meta CPMs on a baseline week, the problem is almost never the auction. It is your account. Fragmented ad sets and stale creative drift toward the ceiling because Meta's Andromeda algorithm grades the creative itself and prices delivery accordingly. A consolidated Advantage+ structure with a disciplined creative rotation drifts toward $14 to $18. The fix sits inside your account structure and your creative velocity, not your bid.
CPC Benchmarks: Where the Click Actually Costs Less
Meta CPCs for ecom traffic campaigns sit at $0.70 to $1.35, with a cross-campaign median around $1.11. Fashion is the cheapest vertical at $0.45 to $0.60, largely because the visual nature of the product pulls high CTR. TikTok clicks run $0.30 to $1.50 with a $0.50 median, which puts them roughly 40% to 50% cheaper than Facebook and up to 70% cheaper than Instagram.
Remember CPC is derivative. It is CPM divided by CTR times ten, so a "good" CPC can mask a broken hook (a high CTR on bad traffic still yields cheap clicks that convert badly). Use it as a pulse check, not a verdict.
| Category | Meta CPC | TikTok CPC |
|---|---|---|
| Fashion / Apparel | $0.45 to $0.60 | $0.40 to $0.80 |
| Beauty | $0.60 to $1.00 | $0.50 to $0.90 |
| Health & Wellness | $0.80 to $1.30 | $0.40 to $0.80 |
| Food & Beverage | $0.42 to $0.80 | $0.40 to $0.70 |
| Electronics | $0.90 to $1.35 | $0.50 to $1.00 |
| Finance / Insurance | $1.22+ | n/a |
Hook Rate Benchmarks: The First 3 Seconds
Hook rate is the leading indicator that prices everything downstream. Meta measures it as 3-second video plays divided by impressions; TikTok uses a 2-second threshold. If users scroll past before the offer lands, CTR and CVR are mathematically irrelevant.
On Meta, a 25% to 30% hook rate is solid table stakes. 30% to 40% is good. 40%+ is elite. Anything under 15% to 20% means the creative is losing the auction outright. TikTok runs 5 to 10 points higher across the board because of native sound, faster scroll velocity, and a younger audience. The behavioral context: average individual TikTok video watch time is roughly 8.4 seconds, and the opening 2 seconds dictate over 70% of total retention. Power users compress their swipe interval the longer they stay in the app, so the hook is doing almost all the work.
UGC and direct-to-camera founder testimonials routinely hit 60% to 70% hook rates when executed well, and they pull CPAs 20% to 30% below polished studio alternatives. Beauty before-and-after content hits 30% to 42%+ on average.
| Tier | Meta (3-sec) | TikTok (2-sec) | Diagnosis |
|---|---|---|---|
| Failing | < 20% | < 25% | Opening visual is wrong; algorithm is penalizing CPM |
| Solid | 25% to 30% | 30% to 35% | Table stakes, creative is in the auction |
| Good | 30% to 40% | 35% to 45% | Earning algorithmic favor |
| Elite | 40%+ | 45%+ | Top-quartile; UGC and founder POV cluster here |
| Specialist | 60% to 70% | 60% to 70% | Direct-to-camera UGC, before/after Beauty |
How to lift a sub-25% hook rate
A failing hook rate is a creative problem, not a media problem. No budget reshuffle or audience tweak fixes a thumb-stop failure. Diagnose and rebuild the opening 2 to 3 seconds; read more in creative direction and creative as targeting.
CTR Benchmarks: Attention to Intent
Meta CTR for conversion campaigns ranges 1.5% to 2.8%, with Fashion at 2.84%, Beauty at 2.50%, and Health & Wellness at 2.30%. The load-bearing fact: Meta's algorithm punishes ads that drop below 1.5% by escalating their CPM, so a weak CTR compounds into higher costs everywhere else.
TikTok CTRs are structurally lower at 0.5% to 1.5% with a 0.84% average, because the platform is built for passive viewing. An ad above 1.0% on TikTok is highly effective. Beauty pulls 1.0% to 1.5%, general ecom 0.9% to 1.2%.
| Category | Meta CTR | TikTok CTR |
|---|---|---|
| Fashion / Apparel | 2.84% | 0.9% to 1.2% |
| Beauty | 2.50% | 1.0% to 1.5% |
| Health & Wellness | 2.30% | 0.9% to 1.3% |
| Food & Beverage | 1.8% to 2.2% | 0.8% to 1.1% |
| Electronics | 1.5% to 2.0% | 0.7% to 1.0% |
| Finance / Insurance | 1.0% to 1.5% | n/a |
The hook-hold-CTR diagnostic chain
Use this in order. Do not skip steps.
- Hook rate below 25% → opening 3 seconds is wrong. Rebuild the cold open.
- Hook fine, hold rate weak → narrative body of the ad fails. Rewrite the middle, not the opener.
- Hook and hold fine, CTR under 1% → offer or CTA lacks urgency. Change the ask, not the creative.
Landing Page CVR: The Numbers That Actually Matter by AOV
The "2% to 3% rule" is the most misused number in DTC. Price point shapes conversion more violently than category, traffic source, or device, so the AOV tier is where you start.
| AOV Band | Median CVR | Top Quartile CVR |
|---|---|---|
| Under $30 | 4.2% | 7.1% |
| $30 to $100 | 2.9% | 5.0% |
| $100 to $300 | 2.1% | 3.8% |
| $300+ | 1.4% | 2.6% |
If you sell $250 jackets and convert at 1.6%, you are around median for your AOV and your problem is not your landing page. If you sell $24 snacks at 1.6%, the funnel is leaking 60% of its potential.
Mobile vs Desktop: the 42% gap that's eating your spend
Mobile drives 84.4% of ecom traffic and converts at less than half the rate of desktop. Mobile CVR sits at 1.8% to 2.87% against desktop at 3.2% to 4.51%, a 42% gap that has not closed despite a decade of "mobile-first" design. The driver is checkout friction (form filling, trust, distraction), which compounds on a small screen.
Fashion is the worst case: 78% of traffic is mobile and mobile CVR is 1.2% versus 1.9% on desktop. If you are an apparel brand, this single gap is probably your largest revenue leak.
CVR by category
| Category | Median CVR | Notes |
|---|---|---|
| Food & Beverage | 4.9% to 6.2% | Low AOV, habitual replenishment |
| Beauty / Personal Care | 4.9% | Inflated by routine purchase behavior |
| Fashion / Apparel | 2.4% to 3.3% | Women's 3.6%, men's 0.8% |
| Electronics | 1.4% to 1.58% | Research-heavy, spec comparison |
| Luxury / Jewelry | 0.7% to 1.19% | Deliberative purchases |
The rule: a 1.2% CVR is elite for luxury and a failure for snacks. Stop comparing across categories.
CVR by traffic source
Intent at the click is everything. Cold paid social brings the lowest-intent traffic outside of programmatic display, and that is reflected in the numbers, not a fault of your site.
- Email (existing customers): 4% to 8%
- Paid Search: 2% to 5%
- Meta retargeting: 2% to 5%
- Meta cold prospecting: 1.5% to 2.5%
- TikTok paid: 0.8% to 2.0%
TikTok's low CVR is structurally normal. The platform is in "entertainment mode" and gets paid for in the cheaper CPC.
CPA Benchmarks: What a Sale Actually Costs on Each Platform
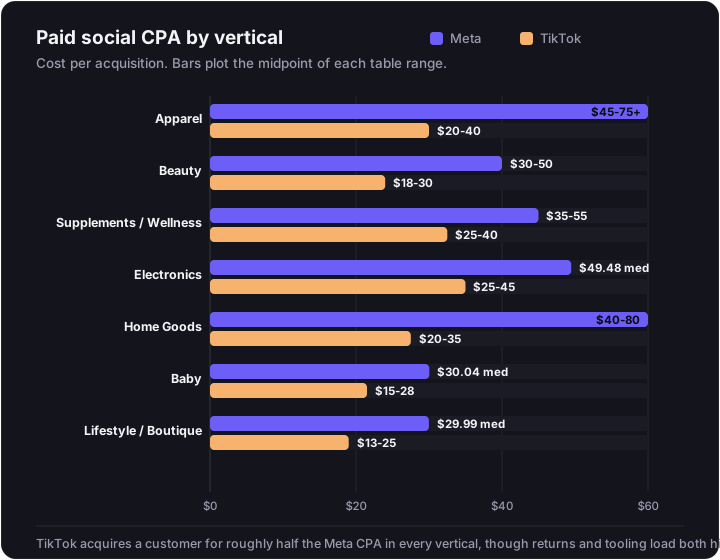
Across 20,000+ DTC accounts, the median Meta CPA is $38.17. TikTok ecom comes in slightly lower at $32.74 median, ranging $13 to $31 by vertical. The cheapest Meta CPAs sit in Lifestyle/Boutique ($29.99) and Baby ($30.04). The most expensive are Electronics ($49.48) and Travel Accessories ($48.37).
| Vertical | Meta CPA | TikTok CPA range |
|---|---|---|
| Apparel | $45 to $75+ | $20 to $40 |
| Beauty | $30 to $50 | $18 to $30 |
| Supplements / Wellness | $35 to $55 | $25 to $40 |
| Electronics | $49.48 (median) | $25 to $45 |
| Home Goods | $40 to $80 | $20 to $35 |
| Baby | $30.04 (median) | $15 to $28 |
| Lifestyle / Boutique | $29.99 (median) | $13 to $25 |
Why platform CPA undercounts your real cost
Platform CPA is the cost per pixel-attributed purchase. It ignores creative production, agency fees, software, and the brutal reality of returns. Apparel return rates run 24% to 26%; swimwear and lingerie 30% to 50%; footwear and luxury 15% to 20%.
Worked example: a denim brand with a $75 headline Meta CPA and a 26% return rate is actually paying $101 to keep a customer. Add creative production and tooling on top and the true CAC routinely lands 2x to 3x the dashboard number. Read the full math in true CAC and the survivability layer in contribution margin.
Platform ROAS Benchmarks: Meta vs TikTok
The headline number from 2025: median ecommerce ROAS dropped to 2.87x and half of DTC stores operate below 2.04x. Meta runs 1.86x to 2.19x blended, with retargeting often past 3.6x and Advantage+ Shopping prospecting at 1.2x to 2.5x. TikTok averages 1.41x baseline, jumping to 2.25x when Value Optimization is on (a bidding mode that trains the algorithm to chase higher-LTV buyers, not the cheapest converters).
| Strategy | Typical Platform ROAS |
|---|---|
| Meta blended | 1.86x to 2.19x |
| Meta Advantage+ prospecting | 1.2x to 2.5x |
| Meta retargeting | 3.6x+ |
| TikTok standard | 1.41x |
| TikTok Value Optimization | 2.25x |
| Google Search (reference) | 3.31x to 3.5x |
The caveat under everything in this table: platform ROAS systematically over-credits. View-through attribution and multi-channel overlap mean Meta and Google routinely both claim 100% of the same sale, and the sum of platform-reported revenue often exceeds actual Shopify revenue by 30% to 60%. Optimizing to platform ROAS in isolation is how mid-market brands quietly scale into losses.
The break-even ROAS depends on your margin
A brand with a 60% gross margin breaks even at 1.66x ROAS. A brand with 25% margins needs 4.0x just to survive. That is the same dashboard number meaning two completely different things. Calculate your floor first, then read the benchmark against it (full mechanics in break-even ROAS).
Blended MER: The Only Number That Tells You If You're Profitable
MER is total website revenue divided by total marketing spend, across all channels, ignoring attribution. It is the bank-account test.
Healthy DTC operates at an MER of 2.5x to 4.0x. By vertical: Apparel 2.1x to 3.4x (Q4 pushing into the 4.0s), Supplements 3.0x to 5.5x, Furniture and Home Goods 1.5x to 2.5x (justified by massive AOV), Luxury north of 5.0x on an LTV:CAC basis.
| Vertical | Healthy Blended MER |
|---|---|
| Apparel & Accessories | 2.1x to 3.4x (Q4 to 4.0+) |
| Supplements / Wellness | 3.0x to 5.5x |
| Beauty | 2.8x to 4.5x |
| Home Goods / Furniture | 1.5x to 2.5x |
| Luxury | 2.0x to 3.0x (offset by LTV) |
The scaling test that matters: when brands push Meta prospecting spend up 30% to 50% while running Google Performance Max to harvest the resulting demand, total revenue typically rises 10% to 25% and platform Meta ROAS drops 10% to 20%, but blended MER holds flat or improves. That is a winning scale. Reading the Meta ROAS in isolation would have told you to pause the campaign that was actually working.
MER vs platform ROAS in one diagram
The full mechanics, including how to set an MER floor and stop the platform-ROAS panic-pause, live in our MER vs ROAS breakdown, with the attribution plumbing and incrementality testing it depends on.
Quick-Reference: The 2026 Paid Social Benchmark Card
| Metric | Meta (DTC) | TikTok (DTC) | Healthy if... |
|---|---|---|---|
| CPM | $18 to $45 (median $13 to $18) | $4 to $13 (median $8.30) | Sitting in the bottom third of band |
| CPC | $0.70 to $1.35 | $0.30 to $1.50 (median $0.50) | At or below category median |
| CTR | 1.5% to 2.8% | 0.5% to 1.5% | Meta above 1.5%, TikTok above 1.0% |
| Hook Rate | 25% to 30% solid, 40%+ elite | 30% to 35% solid, 40%+ elite | Above 25% Meta, 30% TikTok |
| CVR | 1.5% to 2.5% (cold) | 0.8% to 2.0% | Read against your AOV tier |
| Platform CPA | $38.17 median | $32.74 median | Below LTV / 3 |
| Platform ROAS | 1.86x to 2.19x | 1.41x (2.25x w/ VBO) | Above your margin-adjusted breakeven |
| Blended MER | 2.5x to 4.0x | 2.5x to 4.0x | Above your break-even MER, holding under scale |
What to Do When Your Numbers Are Off
Three branches. Diagnose, then route.
- CPM is high or hook rate is sub-25% → creative problem. Read creative as targeting and rebuild the opening through creative direction.
- CVR is low for your AOV and category → landing page or funnel friction. Mobile checkout is almost always the first place to look.
- Platform ROAS looks fine but MER is weak → attribution and scaling problem. See scaling mechanics and why ads stopped working for the diagnostic flow.
Get a Read on Your Numbers
Benchmarks tell you whether something is broken. They do not tell you which lever to pull, in what order, on your specific account. That is what a paid media audit does: pulls your numbers against the bands above, isolates the layer that is bleeding, and hands back the three changes that move MER. If the diagnosis points at creative as the bottleneck (and at these benchmarks, it usually does), our creative agency takes it from there.