
An ltv cohort analysis is the only honest read on which acquisition channels actually fund your business. First-order ROAS tells you who bought cheap on Tuesday. The cohort curve tells you who paid back by week eight, which channel never paid back at all, and which creative quietly funded the next six months of growth.
What an LTV cohort analysis actually tells you
First-order ROAS tells you who bought cheap. An LTV cohort curve tells you who pays back. The payback point on that curve, by channel and creative, is the spend decision your media buyer should be making this week.
An LTV cohort analysis groups customers by their acquisition month, then plots the cumulative contribution margin that cohort generates at 30, 60, 90, 180, and 365 days against the cohort's CAC. The month the curve crosses CAC is the channel's true payback point. Channels whose curves never cross the line are losing money no matter how cheap the first click looked on Day 0.
That single shift, from event-level ROAS to cohort-level margin, is what separates brands that can scale paid media from brands that are quietly financing one-time buyers out of working capital. McKinsey's 2024 DTC commerce data found brands tracking 12-month LTV by acquisition cohort were 2.4x more likely to profitably scale paid media than brands relying on single-transaction ROAS.
Why first-order ROAS misallocates your budget
Day-zero ROAS rewards the cheapest possible click. That sounds neutral. In practice it rewards discount hunters, retargeted bottom-of-funnel buyers who would have converted organically, and any creative that promises 40% off. The retention tail of those cohorts is brutal, and the cohort curve is the only place it shows up.
A few specific reasons the platform numbers no longer hold:
- Platform double-counting. Meta, Google, and TikTok each claim 100% credit for the same purchase inside their own attribution silo. Three networks all reporting wins while blended profitability stays flat is the most common pattern in a stuck account.
- The 2026 Meta API change. Meta removed the 7-day and 28-day view-through windows from the Ads Insights API and redefined click attribution to exclude social interactions (likes, shares, profile visits), pushing those into a 1-day engage-through window. Platform-reported conversions dropped 15% to 40% overnight depending on the account.
- The blended-average trap. When revenue rises but cash shrinks, the answer is almost never missing data. It is an extended payback period hidden by averages that mix February's compounding cohort with March's discount-hunter cohort.
The fix is structural, not cosmetic. You need a clean data layer feeding cohort math, which starts with server-side tracking and the broader attribution stack.
The five ingredients of a usable cohort curve
Before any cohort math is honest, the data layer has to carry five things. Most brands have two or three and substitute averages for the rest, which is why their curves look smoother than reality.
- A unique
customer_id(usually hashed email), theorder_date, and a per-ordercontribution_margincalculated from real costs, not gross revenue. - Fully burdened margin. Subtract COGS, pick-and-pack, outbound shipping, packaging, payment processing, and predicted returns. Apparel and footwear return rates run 20% to 40% in 2026; consumer electronics 8% to 15%. Modeling returns at zero inflates every cohort by 10 to 30 points of margin.
- The acquisition channel and campaign tagged on the FIRST order only. Cohort assignment is permanent; a customer acquired by Meta in January stays in the Meta January cohort even when their second purchase comes through email.
- Ad spend reconciled to net new customers, not all conversions. CAC divides by net new customers; CPA divides by purchase events. Mixing them is how brands convince themselves they have a $25 CAC while they actually have a $65 one.
- Time-horizon caps. Use 60-day for cash-flow decisions, 12-month for planning, 36-month as a hard ceiling. Anything beyond 36 months is statistical fiction.
Internal definitions live elsewhere: see contribution margin for the per-order math and customer lifetime value for the LTV formula itself.
How to build the curve, step by step
The construction is mechanical. The discipline is in refusing to skip steps three and four when the spreadsheet gets tedious.
- Export raw transactions from the storefront (Shopify, BigCommerce, Magento) and daily ad spend from each network (Meta, Google, TikTok, YouTube, native).
- Tag every customer with
first_purchase_dateand group them by acquisition month. The "March 2026 cohort" is now a fixed list of customer IDs. - Compute contribution margin per order. For every line item from that cohort, subtract COGS, fulfillment, shipping, payment fees, and predicted returns. Do not stop at gross margin.
- Compute the cohort's CAC. Divide the month's blended ad spend by net new customers acquired. Plot CAC as a negative starting point on the y-axis, the cash hole the cohort starts in.
- Plot cumulative margin per user at 30, 60, 90, 180, and 365 days. The month the curve crosses zero (or, equivalently, crosses the CAC line above zero) is the cohort's payback point.
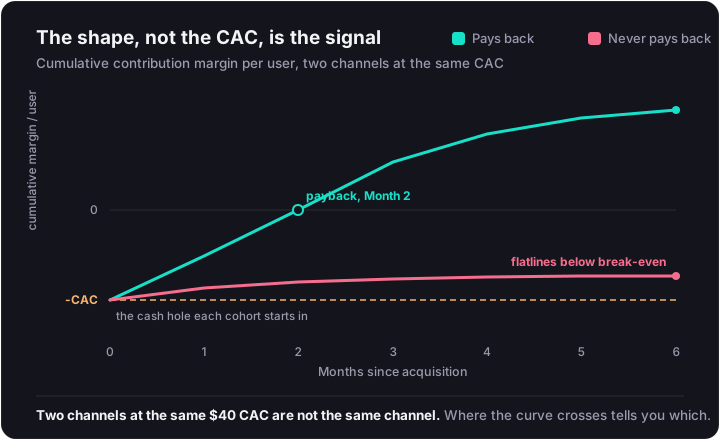
Reading the curve: the CAC payback point
The payback point is the load-bearing read. Everything else, ratios, lifetime multiples, channel narratives, is downstream of where the curve crosses the line.
Four shapes are worth memorizing:
- Flatline after Month 1. Classic "one-and-done" cohort. The channel is acquiring buyers who do not come back, and the business is on a perpetual ad-spend treadmill to replace them.
- Aggressive climb past CAC. Cohort compounds. Scale ceiling is high and the constraint is working capital, not customer quality.
- Asymptotic flattening after Month 6. Healthy long-tail loyalty. The early steepness pays back CAC, the gradual slope after that is contribution margin funding fixed costs and the next round of acquisition.
- Same CAC, different shape. Two channels at $40 CAC where one curve crosses at Month 2 and the other never crosses are not "the same channel." The shape, not the CAC number, is the channel-quality signal.
Benchmark windows for payback periods (1 to 3 months exceptional, 3 to 6 standard, 6 to 12 venture-grade, 12+ a red flag for bootstrapped retail) live at CAC payback. The argument over whether 3:1 still applies once you switch to contribution-margin LTV lives at LTV:CAC ratio.
Worked example: $25 CAC that loses money vs $50 CAC that compounds
Set up the same way most accounts run a "channel test." Allocate $10,000 each to two campaigns in January 2026. Cohort A is Meta prospecting, a subscription-value video at full price. Cohort B is a TikTok influencer placement with a 40%-off first-order hook. The brand's baseline: $50 AOV, 60% contribution margin, so a full-price order yields $30 in margin and a 40%-off order yields $18.
| Metric | Cohort A (Meta, full price) | Cohort B (TikTok, 40% off) |
|---|---|---|
| Ad spend | $10,000 | $10,000 |
| New customers | 200 | 400 |
| CAC | $50.00 | $25.00 |
| Month 0 cumulative CM / user | $30.00 | $18.00 |
| Month 1 cumulative CM / user | $45.00 | $21.00 |
| Month 2 cumulative CM / user | $57.00 (payback) | $22.50 |
| Month 3 cumulative CM / user | $67.50 | $23.25 |
| Month 6 cumulative CM / user | $95.00 | $24.00 |
| Payback month | Month 2 | Never |
A junior media buyer kills Meta on Day 0. CAC is double, Month 0 margin per user is lower, and the platform dashboard tells a clean story: TikTok is winning. The cohort curve tells the opposite story. Cohort B caps at $24.00 in cumulative margin per user against a $25 CAC and loses roughly a dollar per customer in perpetuity. Cohort A crosses the $50 CAC line at Month 2 and nearly doubles it by Month 6.
The "cheap CAC" on TikTok was not cheap. It was a discount-hunter siphon paid for with the brand's margin.
Using the curve as a budget-shift tool
The curve only earns its keep when it forces budget decisions you would not have made on Day-0 numbers. Three decisions come up almost every week.
Channel reallocation
Stack the 90-day cumulative CM/user curves of Meta, Google, TikTok, YouTube, and native against each channel's CAC. Cap or cut spend on channels whose curves flatten below CAC. Raise spend ceilings on channels that compound. One pattern from the research worth flagging: Google Search has shown 3x higher 6-month LTV than display network traffic in some stacks, even at comparable Day-0 CPA. That is a budget reallocation decision worth millions and a Day-0 dashboard will never surface it.
Curves prove correlation between channel and retained buyers. Whether the channel caused the retention is a separate question answered by incrementality testing. The full set of channel options sits in the channel map.
Creative-level cohort reads
This is where cohort analysis stops being a finance exercise and starts changing media buys. Two Meta prospecting ads can land at an identical $35 CPA. One features product durability and produces a 90-day LTV of $62 (a 1.77x multiple on CAC). The other uses a sensationalist clickbait hook and lands a 90-day LTV of $38 (a 1.09x multiple).
On the CPA dashboard they are identical. On the cohort curve, the durability ad is 60% more profitable. Scaling budget should chase the framework behind that ad, not the hook of the other.
The test design that surfaces this lives at creative testing; the underlying argument for why creative now carries the targeting signal sits in creative is the new targeting.
Product-gateway identification
Cohort curves also expose which first-purchase SKU predicts the highest 6-month LTV. A skincare brand might find that customers whose first purchase is a starter bundle produce roughly 3x the 6-month LTV of customers who first bought a standalone moisturizer. That insight restructures the front-end funnel: accept a higher CAC on the bundle because the back-end cohort math guarantees profitability.
When a cohort curve says payback is too slow
If the curve sits past Month 12 before crossing CAC, the answer is rarely "pause everything." Several levers compress payback without touching the media plan:
- Raise first-order AOV. Multi-pack minimums on low-AOV SKUs, hero-SKU price tests, mandatory accessories.
- Post-purchase one-click upsells. Inject the offer between checkout and the thank-you page to capture Month-1 margin on Day 0.
- Raise the free-shipping threshold. Forces accessory attach and recovers variable logistics cost.
- Unbundle high-CAC starter kits. Lower the entry price, acquire the customer cheaply, sequence the rest of the kit through owned email and SMS at zero incremental CAC.
These are surface-level. The full menu of retention and revenue-expansion levers sits at raising LTV, and the subscription-specific cohort mechanics (replenishment-driven steepness, churn modeling) live at subscription LTV.
What the cohort curve will NOT tell you
The cohort curve is not a real-time bidder and it is not a causal proof. Two honest limits:
- The timing paradox. To know a cohort's true 12-month value, you have to wait 12 months. By the time the January cohort's payback is empirically confirmed, the creative that produced it is long dead and the auction has moved. Cohort LTV is a planning and post-mortem tool. Predictive LTV (built on BG/NBD plus Gamma-Gamma models) tries to close that gap by inferring lifetime value from early signals, and platforms like Voyantis and Pecan AI productize it at the enterprise tier.
- The statistical floor. Predictive LTV models hallucinate badly below 500 to 1,000 customers per cohort. GA4 alone requires at least 1,000 returning users with purchase events over a 28-day period to even generate a model. Brands smaller than that should optimize on 60-day payback only and treat any 12-month projection as directional at best.
The formula-level comparison of historic, cohort, and predictive LTV sits at customer lifetime value. The question of whether a channel causes retention or merely correlates with it is settled by incrementality testing.
The tool stack that makes this analyzable
Doing cohort analysis in a spreadsheet is feasible up to a few thousand customers and then stops being feasible. The 2026 ecosystem stratifies by data complexity and ad-spend volume.
| Tool | Core competency | Best fit | 2026 price band |
|---|---|---|---|
| Triple Whale | DTC analytics OS and first-party attribution | Shopify-native brands, $1M to $10M GMV | Free tier; paid from ~$129 to $219/mo |
| Lifetimely (AMP) | LTV, profit, and cohort retention focus | Founders optimizing on unit economics | Free under 50 orders; tiers up to $149/mo on the base plan |
| Polar Analytics | No-code BI on a Snowflake-backed warehouse | Shopify Plus brands with SQL-literate analysts | ~$300 to $750/mo |
| Northbeam | ML attribution and Media Mix Modeling | Enterprise DTC, $50K+ monthly ad spend | Starting from $1,500/mo |
| Saras Pulse | Enterprise ELT data pipeline | Omnichannel brands at $5M-$20M+ hitting the fragmentation wall | Custom enterprise |
| Admaxxer | First-party pixel + UTM cohort LTV at ad-set level | Founders and agencies needing cheap server-side tracking | $9 to $499/mo |
| Peel Insights | Automated retention analytics and basket analysis | Brands without dedicated data analysts | Starts at $149/mo |
The practical pattern: Shopify-native brands under $10M default to Triple Whale or Lifetimely. Media buyers spending over $50K/month move to Northbeam for MMM. $5M+ omnichannel brands hit the operational "fragmentation wall," where marketing, finance, and ops report conflicting metrics from isolated systems, and shift to Saras Pulse or Polar for a unified data layer. Brands spending under $30K/month should not buy Northbeam; the ML has insufficient volume to operate and the base price destroys unit economics.
How this fits the rest of the metric stack
Cohort analysis is not a standalone metric. It sits in a specific seat in the broader stack.
- It is the truth-test that blended MER and the rest of the paid media metrics eventually settle on.
- It feeds the LTV:CAC target with a time-aware payback constraint, not just a 3:1 number on a slide.
- It validates, or quietly kills, the channel mix the performance marketing plan assumed at the start of the quarter.
If those three checks line up, your media buyer can press scale with conviction. If they do not, no amount of creative volume will fix it.
Where to take this next
If your cohort curves are flatlining past Month 2, the leak is almost always upstream of media buying. A paid media audit reconstructs cohort curves channel-by-channel and isolates which campaigns are buying compounding cohorts versus one-time discount hunters, before the next budget cycle locks the misallocation in.
For brands ready to operationalize cohort-driven decisions inside the creative engine, the performance creative engagement rebuilds the testing layer so every winning ad gets re-read on 90-day LTV, not Day-0 ROAS. That is the loop that lets you scale a winning channel without watching the curve flatten three months later.