Brand vs Performance Marketing: How DTC Splits Budget
The brand vs performance marketing debate is the wrong frame. For a DTC brand deciding where the next dollar goes, these are not competing line items, they are compounding levers on the same P&L. The textbook 60/40 brand-to-performance split, lifted from Binet and Field's IPA Databank work, was built on mature CPG data and tends to wreck cash flow when applied to brands under $30M in revenue. The working answer is a stage-gated mix, not a rule.
The 60/40 Rule Is Wrong for Most DTC Brands
Use a 50/30/20 baseline (50% acquisition, 30% retention, 20% brand and innovation) and then gate the brand-vs-performance ratio inside it by revenue stage. Startups run 15/85 to 25/75 brand-to-performance. By $5M to $25M, the ratio moves toward 40/60 or 50/50. Only above $25M does the classic 60/40 (or 70/30) start to make sense.
The math behind that order matters. Brand spend is not an unmeasurable luxury. McKinsey's brand-equity data shows strong brands carry CAC up to 35% lower than unknown competitors. Fospha's 2025 Peak Playbook, drawing on $2.8B in managed spend across more than 83,000 campaigns, found that brands allocating just over 5% of digital budget to awareness and consideration saw ROAS lifts of 22% (sub-$600K monthly spenders) up to 218% (over $600K monthly).
Two ideas to anchor before going deeper:
- The 60/40 rule is a destination, not a starting line.
- Brand investment is a multiplier on the performance line, measurable through CAC, CTR, CVR, and branded search.
Why the 60/40 Rule Breaks Under $30M Revenue
The 60/40 rule isn't wrong, it's misapplied. Binet and Field built it from mature, national consumer goods brands with massive existing distribution and capital reserves. Applying that split to a $5M apparel scale-up is strategy malpractice.
Where the Rule Came From
The IPA Databank evidence behind 60/40 was drawn from large, established CPG advertisers. Those companies already had market share, brand recognition, and balance sheets that could absorb the lag between brand spend and revenue. The rule presumes that infrastructure exists.
The Cash Flow Problem
Brand investment typically takes 18 to 24 months to compound into revenue. An early-stage DTC brand relying on daily Meta returns to fund the next inventory order has no runway for that lag. Telling a bootstrapped founder to redirect 60% of spend into awareness campaigns when payroll runs on this week's ROAS is a bankruptcy memo.
The Opposite Failure Mode
Pure performance has its own ceiling. Brands that obsess over short-term ROAS train their customers to buy only on discount, erode premium positioning, and watch CAC creep upward as algorithms reach colder audiences. At some point paid channels just maintain flat revenue at rising cost, and LTV stagnates because no brand affinity is driving repeat purchase. This is the moment most brands discover ads stopped scaling and start hunting for a structural fix.
What Brand Spend Actually Does to Performance Metrics
Brand is the input that lowers the cost of every performance dollar that follows. Three mechanisms make it measurable.
The Brand Tax
When a consumer sees a direct-response ad from a brand they have never heard of, baseline skepticism forces the advertiser to compensate. Higher frequency, deeper discounts, more CPC pressure in the auction, more friction at checkout. Industry analysts now call this the Brand Tax. Weak brand equity drives up CPC, lowers CTR, and depresses CVR at the same time.
The Efficiency Multiplier
The flip side is the multiplier. McKinsey reports strong brand equity cuts CAC by up to 35% versus unknown competitors. Nielsen finds consumers pay a 25% premium for products from trusted brands. That pricing power feeds back into margin, which loosens the constraint on what you can spend to acquire a customer.
The ROAS Lift, Quantified
Fospha's 2025 Peak Playbook is the cleanest empirical proof. Across $2.8B in managed spend and 83,000+ campaigns:
| Brand allocation | ROAS lift, sub-$600K/mo | ROAS lift, $600K+/mo |
|---|---|---|
| Under 5% | Baseline | Baseline |
| 5% to 10% | +22% | +218% |
| Over 10% | +110% (blended) | +110% (blended) |
The CVR math compounds the same effect with no creative change. A 0.5% lift in conversion rate on a 2.5% baseline is a 20% lift in ROAS by itself. Branded search behaves as the leading indicator: Fospha noted TikTok brand campaigns drove a 40% lift in branded search volume, which downstream becomes the highest-ROAS demand-capture traffic on Google. For the metric stack underneath all of this, see the metric stack and MER vs ROAS.
The 50/30/20 Framework as the Working Baseline
Replace 60/40 with three buckets:
- 50% to acquisition.
- 30% to retention.
- 20% to brand and innovation.
This mix encodes a truth the 60/40 rule glosses: retention is where DTC actually makes money. About 60% of mature DTC revenue comes from repeat buyers, and retaining a customer is roughly 5x cheaper than acquiring one.
50% Acquisition
Direct-response, measurable, scalable. Meta still commands about 63% of DTC ad dollars by virtue of targeting depth. Google Search and Shopping capture intent. TikTok absorbs the rest of the discovery layer. Channel logic and scale mechanics sit inside paid social and scaling paid social.
30% Retention
Email, SMS, loyalty, post-purchase flows, subscription nudges. This is the bucket that subsidizes higher top-funnel CAC by lifting customer lifetime value. Without it, every paid acquisition dollar is judged on first-order economics, which is mathematically brutal in low-AOV categories.
20% Brand and Innovation
CTV and YouTube, OOH, creator partnerships, premium creative production, testing non-linear channels. This is the slice that lowers the Brand Tax and keeps the 50% acquisition bucket viable as channels saturate. It also funds the LTV/CAC expansion that makes everything else compound.
Shifting the Mix by Revenue Stage
The 50/30/20 baseline is correct in spirit, but the brand-vs-performance ratio inside it has to flex with revenue, channel saturation, and unit economics.
| Stage | Revenue band | Marketing % of revenue | Brand vs Performance | Strategic objective |
|---|---|---|---|---|
| Startup | $0 to $1M | 40% to 60% | 15/85 to 25/75 | Survival, product-market fit, near-term cash flow |
| Growth | $1M to $5M | 25% to 40% | 30/70 | Scale proven channels, build retention infrastructure |
| Established | $5M to $25M | 20% to 30% | 40/60 to 50/50 | Defend share, diversify off Meta, invest in LTV |
| Mature | $25M+ | 10% to 20% | 60/40 or higher | Lower blended CAC via mass awareness, organic affinity |
Startup ($0 to $1M): Brand Lives Inside the Creative
At a 15/85 to 25/75 ratio, dedicated awareness campaigns are off the table. Total marketing typically runs 40% to 60% of revenue, or $5K to $15K monthly. One or two channels (Meta and Google Search) absorb almost everything. Brand at this stage is communicated through the craft of direct-response creative: positioning, voice, design, and the quality of the founder story embedded in the ads. There is no separate brand budget. There is a single budget, and brand is how it gets dressed.
Growth ($1M to $5M): Build the Retention Engine
Crossing $1M, the ratio shifts toward 30/70 and total marketing normalizes into the 25% to 40% band. The trigger is mathematical: as performance spend climbs, algorithms reach colder audiences and CAC starts creeping. Middle-funnel content, creator seeding, and email/SMS flows begin earning their slot. This is also when influencer marketing becomes a real line item rather than a side experiment.
Established ($5M to $25M): Brand Becomes the Growth Engine
Between $5M and $25M, brand-to-performance moves to 40/60 and pushes toward 50/50. Channel saturation forces it. The cheapest Meta and Google audiences have been exhausted, and pumping more spend through the same auctions just buys diminishing returns. This is the stage where Binet and Field's evidence finally fits. The fix is upper-funnel: YouTube, CTV, OTT, broad social, formats designed to introduce the brand to net-new demographics. Channel expansion logic sits in channel mix and YouTube ads.
Mature ($25M+): Brand Defends, Performance Harvests
Above $25M, total marketing as a percentage of revenue collapses toward the publicly traded DTC and CPG median (about 13.3%). The split inverts to 60/40 and, in saturated categories, 70/30 or even 80/20. Most revenue comes organically from repeat buyers who already trust the brand. Performance still runs, but as a smaller share, harvesting demand the brand layer creates.
CPA Benchmarks: Why the Mix Depends on Your Vertical
The right brand-vs-performance ratio is also a function of category skepticism. Drawing from $47M in managed ad spend, the 2026 CPA picture across major DTC verticals looks like this:
| Vertical | Average CPA | Friction driver |
|---|---|---|
| Pet products | $23 | Emotional, low-friction impulse buys with strong community |
| Fashion and apparel | $37 | Visual, impulsive, high returns but low purchase friction |
| Beauty and skincare | $42 | Visual platforms favor it; founder content lowers CPA |
| Home goods and furniture | $45 | Higher AOV, more consideration, clear intent |
| Food and beverage | $51 | Low AOV needs bundles; habit-forming retention upside |
| Fitness and athletic gear | $67 | Heavy competition, higher price points |
| Supplements and wellness | $89 | Extreme skepticism, regulatory hurdles, education required |
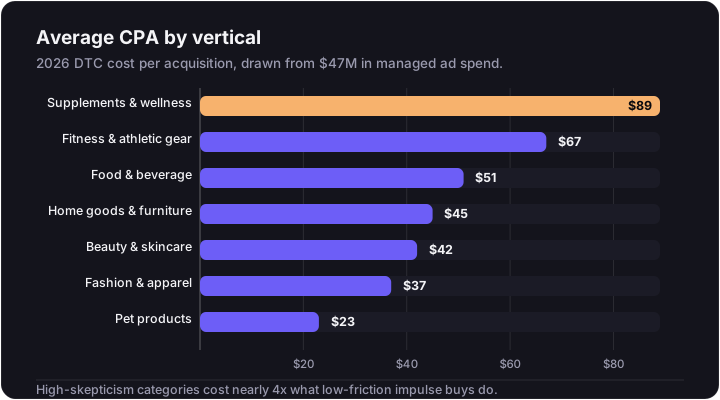
Categories at the top of that list (supplements, fitness) need brand investment earlier than the table headline suggests. The $89 supplements CPA is not a creative problem, it is a trust problem. Performance alone cannot close it. For broader benchmark context across paid social, see paid social benchmarks.
The Unit Economics That Gate Every Decision
The split decision is bounded by AOV and gross margin. Two formulas frame the constraint.
Break-Even ROAS = 1 / Gross Margin %
A brand at 50% gross margin requires a 2.0x ROAS floor just to avoid losing money on a transaction. At 40% margin, the floor is 2.5x. Anything underneath that is burning capital.
Target CAC = (AOV x Gross Margin %) - Target Profit per Order
A furniture brand with $200 AOV and 60% margin has a break-even CAC of $120. If they want $40 of profit per order to cover overhead and fund brand, Target CAC has to stay under $80.
The low-AOV trap is brutal. A brand selling a $35 consumable at 50% margin generates $17.50 in gross profit per order. If CAC is $40, every first order loses $22.50. The only way that brand survives on pure performance is a subscription model that pushes LTV high enough to justify the loss. That is why subscription LTV is the unlock for low-AOV categories, and why the full contribution margin view and CAC and payback math have to drive the budget conversation before any platform ROAS does.
Why Platform ROAS Lies When You Add Brand Spend
The moment upper-funnel spend enters the mix, last-click attribution stops telling the truth.
- Last-click assigns 100% of credit to the final ad clicked. It systematically obscures YouTube, CTV, and demand-gen contribution because those touchpoints rarely close the loop themselves.
- Meta and Google both claim the same sale. The platforms run in silos. If a user sees an Instagram ad on Monday and Googles the brand on Wednesday, both dashboards mark it a win.
The honest scorecards are MER and contribution margin. MER = total revenue / total marketing spend, no cookies, no attribution windows. Healthy blended MER for a scaling DTC brand sits between 3.0x and 5.0x. CM3 (revenue minus COGS, fulfillment, transaction fees, and paid media) is the cash truth: it reveals whether a 4.0x platform ROAS is actually profitable once margin gets factored in.
Deeper treatment lives in MER vs ROAS and attribution stack. To prove brand spend is actually causing the lift rather than coinciding with it, run incrementality testing.
What This Looks Like in Practice
The ceiling-then-pivot pattern shows up at every scale.
Gymshark built its first decade on influencer guerrilla marketing and viral organic moments (a tracksuit launch reportedly drove £30K in 30 minutes). Rather than re-optimize the same transactional ad spend forever, the brand pivoted to community-led brand building. The 2018-2019 Blackout campaign wiped all posts before Black Friday and generated 16M impressions, and the 18,000-square-foot Regent Street flagship turned retail into a brand asset. The result is a $1.45B+ valuation, 10M+ customers, and 18M social followers.
Warby Parker was once the textbook DTC efficiency case on the strength of a $95 Home Try-On model. As digital audiences saturated and privacy shifts pushed industry CAC up over 20%, the brand leaned into physical retail as a brand-marketing channel. Q2 2024 saw 25.5% YoY visit growth, $771M in FY2024 net revenue, and a $3B-ish late-2025 valuation off a 2021 peak near $6.8B. Brand collaborations (the 2024 Chloë Sevigny collection among them) repositioned the brand into a higher-fashion register without abandoning the performance engine.
Hims & Hers runs the cleanest layered model. About 45% to 50% of revenue continues funding acquisition through Meta and TikTok. On top of that, the brand layered subway OOH in major cities, CTV, national television, and celebrity and physician partnerships. The result was a year-over-year decline in blended CAC and 116% YoY revenue growth, with the company crossing a $1.0B run-rate and 1.7M+ subscribers by mid-2024.
The same pattern shows in the mid-market. WildBird got off the broad-spend treadmill, tightened cost controls, focused on high-performing SKUs, and built a creative flywheel of branded content. The brand hit eight figures with an aMER above 11% and a 17.5% profit increase. Obvi retrained the Meta pixel with AI tools to widen its targeting envelope and cut new-customer CPA by 12.1%. The thread across all of them: ceiling, diagnose, layer brand, watch performance metrics improve.
How to Decide Your Split This Quarter
Five questions, each tied to a stage trigger in the table above.
- What is your annual revenue band? This sets the table row and the starting ratio.
- Is blended MER trending down quarter-over-quarter? Falling MER at flat or rising spend is the channel-saturation signal, which is your cue to shift toward brand.
- What is your gross margin? This sets your break-even ROAS floor and tells you whether performance alone is mathematically viable.
- Is branded search volume growing? If it is flat or declining, you are under-investing in upper-funnel and the leading indicator is telling you so.
- Are you discounting to convert? Heavy discount dependency is the Brand Tax revealing itself in your P&L.
If two or more of those answers point the wrong way, the next move is diagnostic, not creative. Start with a paid media audit before adjusting the split.
Where to Go Next
Three reads that close the loop on this decision:
- For the metric layer that makes the split honest: blended MER and the metric stack.
- For the creative half of the equation, since brand investment runs on creative: performance creative.
- For the hands-on path: a paid media audit maps your current split against the stage table and flags the gap. Service overview at performance marketing services.
You
Can you look at our ads?
Want this read on your own ads?
We pull your live ads from the Meta Ad Library, set them next to the longest-running ads in your category, and send back what we'd change and test next. The teardown is free.
Get my free creative teardownWe usually reply within one business day.